What Aegis is
Aegis is the single place your team goes whenever someone has to prove compliance — to a regulator, a customer, an auditor, or your own board.
Aegis — the AI-Powered Compliance Command Center, a Euraika group brand — gathers the scattered pieces of governance, risk and compliance work into one system: your policies, your risks, the evidence that proves your controls are working, the regulatory frameworks you answer to, your vendors, your incidents, your GDPR (the EU data-protection law) records, and your readiness for an audit. Instead of living across a dozen spreadsheets and shared drives, that work sits in one place where every change is recorded and every claim can be traced back to its source.
A few terms recur throughout this guide, so here they are in plain words. A control is a safeguard you put in place to manage a risk — requiring multi-factor authentication, for example. Evidence is the proof that a control is really working, such as an exported report or a screenshot of the setting. A framework is a published set of requirements you measure yourself against, such as ISO 27001 or NIS2 (a European cybersecurity law). A tenant is your own isolated installation of Aegis. The fuller list is in the glossary.
Aegis turns compliance from a periodic scramble into continuous, recorded work, so the evidence behind your regulatory obligations is assembled as you go rather than gathered in a rush when someone asks to see it.
Who uses it
Aegis is built for the people who carry compliance day to day — security and compliance leads, risk owners, data protection officers, IT and operations staff — and for the executives and board members who need a summary they can rely on. What you may see and change depends on your role. There are four:
- Admin — full access, including users, roles, licence and tenant settings.
- Manager — runs the programme day to day: approves, assigns and reviews across modules.
- Contributor — does the work: creates and edits policies, risks, evidence, vendor records and the rest.
- Viewer — read-only. A Viewer can open and read screens, but several modules require Contributor to enter at all and will redirect a Viewer away rather than show a disabled page.
The screen below is what a Contributor sees. The full breakdown of who may do what is in What each role can do.
What's on this screen
Signing in takes you to the Dashboard at /dashboard,
headed Overview of your GRC metrics and compliance status. It is
your home screen and your overview: it does not ask you to do anything, it tells
you where things stand. Learn its regions now, because the same frame surrounds
every other screen in Aegis.
Down the left is the navigation sidebar, headed by the
Aegis wordmark and the Dashboard link, then
collapsible groups — Governance, Risks,
Compliance, Audit, Documents,
Privacy & Whistleblowing, Security Incidents,
Assets (CMDB), AI, Reporting and
Administration. Each opens with the chevron on its right to reveal
the modules beneath. User Guide and Help are pinned at
the foot, and the whole sidebar can be dragged wider or narrower by its
right-hand edge.
Along the top is the bar that follows you everywhere: the name of the
environment or organisation on the left (staging in the captured
tenant), a Search
box, then on the right the language selector (EN), a light/dark
toggle, a help
? that opens the User Guide page for the screen you are on, a
notifications bell with an unread count (99+ in the capture), then
your own initials and name — here Test Contributor 1 — and a
Sign out button.
The main panel holds the dashboard itself. A blue
Getting Started banner sits at the top with a progress bar, a
chevron to collapse it and an × to dismiss it. Beneath it are a
What needs my attention? button, an Ask AI button, a
Refresh control on the right, and a Customize button
that turns on an edit mode for adding, removing and rearranging the cards. Then
come the metric cards: Compliance, Policies,
Open Risks and Vendors across the top, with
Pending Reviews and Vulnerability Intelligence below.
To the right of the second row is a Framework Progress list, and
lower down a Compliance Trend chart with an
All frameworks selector. A round AI button floats in the
bottom-right corner of every screen where AI is enabled for your tenant.
The numbered callouts on the figure below follow the steps in this section, from the banner at the top to the trend chart at the foot. The figures quoted are from a seeded demonstration tenant; your own numbers will differ. What matters is where each one lives on the screen.
-
Start with the blue
Getting Startedbanner across the top. Its bar tracks your setup progress (here6/8 steps — 75%) and the chevron opens the list of remaining steps. The×dismisses the banner for your account, so leave it in place until setup is done — the steps themselves are covered in First-time setup. -
Select
What needs my attention?. A dialog opens and the AI writes a short briefing of what is outstanding across modules right now — reviews due, risks left open, vendors flagged. It reads your data and reports; it changes nothing. -
Look at the
Compliancecard, first in the row beneath. It gives your overall score (here0%, labelledOverall score). The figure stays at0%until controls are mapped to frameworks and evidence is attached, so a low number on a young tenant is expected. Selecting the card opens Compliance frameworks. -
Select the small
?in the corner of theOpen Riskscard. The AI explains in plain words how that number is arrived at and what sits behind it. Every metric card exceptVulnerability Intelligencecarries the same?, and it only explains — it changes nothing. -
On the right,
Framework Progresslists each framework enabled for your tenant with its coverage bar — in the captureBSI C5:2020at2%,CyberFundamentals Frameworkat1%, andCCPA / CPRA,CMMC 2.0andCyber Resilience Actat0%. The+25 moreline at the foot counts the frameworks the card has no room for; it is a label, not a control, and the full list is in Compliance frameworks. -
Lower down, the
Compliance Trendchart plots the score over time. Its selector switches betweenAll frameworks— a single line for the combined score — and a line per framework, which is the quicker read when one obligation is lagging.
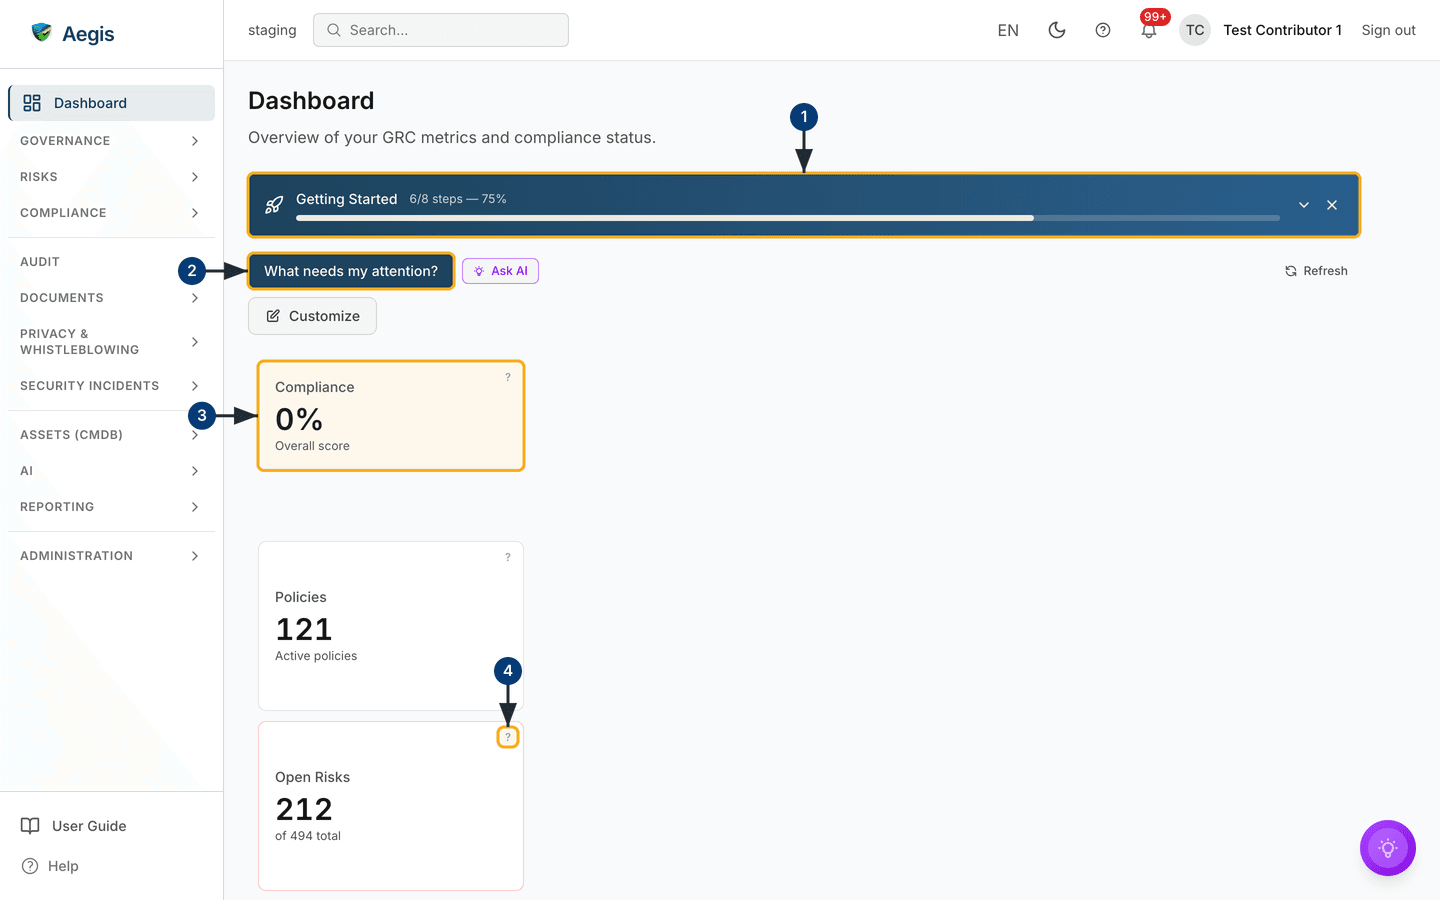
The cards without a callout are counters, and each opens the module behind it.
Policies counts your active policies (here 120) and
opens Policies. Open Risks shows how
many risks are still open against the total on the register (here
215 of 498 total) and opens
Risks. Vendors counts the suppliers you
track (here 169), calls out how many are high risk (here
82) and opens Vendors.
Pending Reviews counts the policies waiting on a review (here
41) and also opens Policies.
Vulnerability Intelligence, between them, shows the state of the
CVE feed — Synced, 32,488 CVEs tracked,
1,676 actively exploited, last updated 3 hours ago.
Selecting it opens Risks, where CVE-linked findings
live. Where the feed is not configured, the card says so rather than showing a
number.
The dashboard is covered in full — the banner, the Customize button
and every card — in The dashboard. The surrounding
sidebar and top bar are explained in
The screen layout and
The left menu.
What lives where
Each sidebar group holds a family of modules. Use this as a map when you are not sure which group holds what you are after.
| Sidebar group | What you do there | Start with |
|---|---|---|
Governance |
Write, approve and publish policies, procedures and playbooks. | Policies |
Risks |
Keep the risk register, assess vendors, record exceptions. | Risks |
Compliance |
Map controls to frameworks and attach the evidence behind them. | Compliance frameworks |
Audit |
Prepare for an audit, run a mock audit, read the audit log. | Audit readiness |
Documents |
Read and work on compliance documents, and comment alongside colleagues. | Compliance documents |
Privacy & Whistleblowing |
GDPR records, data subject requests, DPIAs, concern reports. | GDPR |
Security Incidents |
Log and work incidents, and meet reporting deadlines. | Incidents |
Assets (CMDB) |
Record the systems, software and services you rely on. | Assets |
AI |
See what the AI has been asked to do, and run the AI agents and playbooks. | The AI assistant |
Reporting |
Produce reports for management, the board and customers. | Board reports |
Administration |
Users, roles, licence, connectors and tenant settings. | Settings |
The AI assist
Aegis includes an AI assistant that can draft a policy, suggest how a control maps to a framework requirement, research a vendor, summarise a long document, or write the attention briefing in step 2. It saves you the first draft and the legwork. It does not act on its own and it decides nothing: a person reads every suggestion and chooses whether to accept, edit or discard it. Responsibility for what you publish and attest to stays with your organisation. Every AI action is recorded, and each billable action draws one credit from your licence's monthly AI allowance; chat and translation are free — The AI assistant explains both.
Tips and limits
- Aegis is single-tenant: one installation serves one organisation, and your data is isolated from every other customer.
- Coverage is broadest for European frameworks. SOC 2 is on the roadmap rather than shipped, so do not expect a SOC 2 report from Aegis today.
- Some governance areas — notably the ISO 42001 (AI management) bodies, standards and process pages — are early scaffolding. They are labelled plainly where you meet them.
- Which modules and frameworks you see depends on your licence tier and the frameworks purchased for your tenant. A missing sidebar group has not been enabled, rather than hidden by your role.
- A low compliance percentage on a new tenant is normal: the score measures recorded coverage, not the state of your organisation. Compliance is never finished; the number exists to show you where the next piece of work is.
Where this connects
If you are new, read Signing in and The screen layout next, then First-time setup and The dashboard. After that the module chapters walk each area in turn, and the scenario chapters — handling an incident, preparing for an external audit — follow one piece of work all the way through. Getting help lists the common problems and how to reach support.