Environmental Metrics
Record per-site environmental figures — water, energy, waste, emissions and turnover — period by period, and watch the trend build behind your ESG reporting.
ESG (environmental, social and governance — the non-financial performance a company is increasingly asked to report) starts with measurement. This screen is the measurement half: a register of environmental KPIs (key performance indicators — the numbers you steer by), each one tied to a site (a physical location such as a plant or office), a category, a measurement period and a unit. You record the numbers in their native units — kWh, m³, tonnes — and Aegis charts the trend per series, against a target where you have set one.
Who uses it
- Contributor — can record and edit metrics, and import them in bulk from a spreadsheet.
- Manager — everything a Contributor can do, plus deleting a metric.
- Admin — everything.
- Viewer — can open the page, use every filter and read the trend, but cannot record, import or change anything.
Environmental Metrics is part of the Professional and Enterprise tiers. On a tenant without it, the sidebar link is hidden and the route redirects — if you expected it and cannot see it, ask your administrator about your licence.
What's on this screen
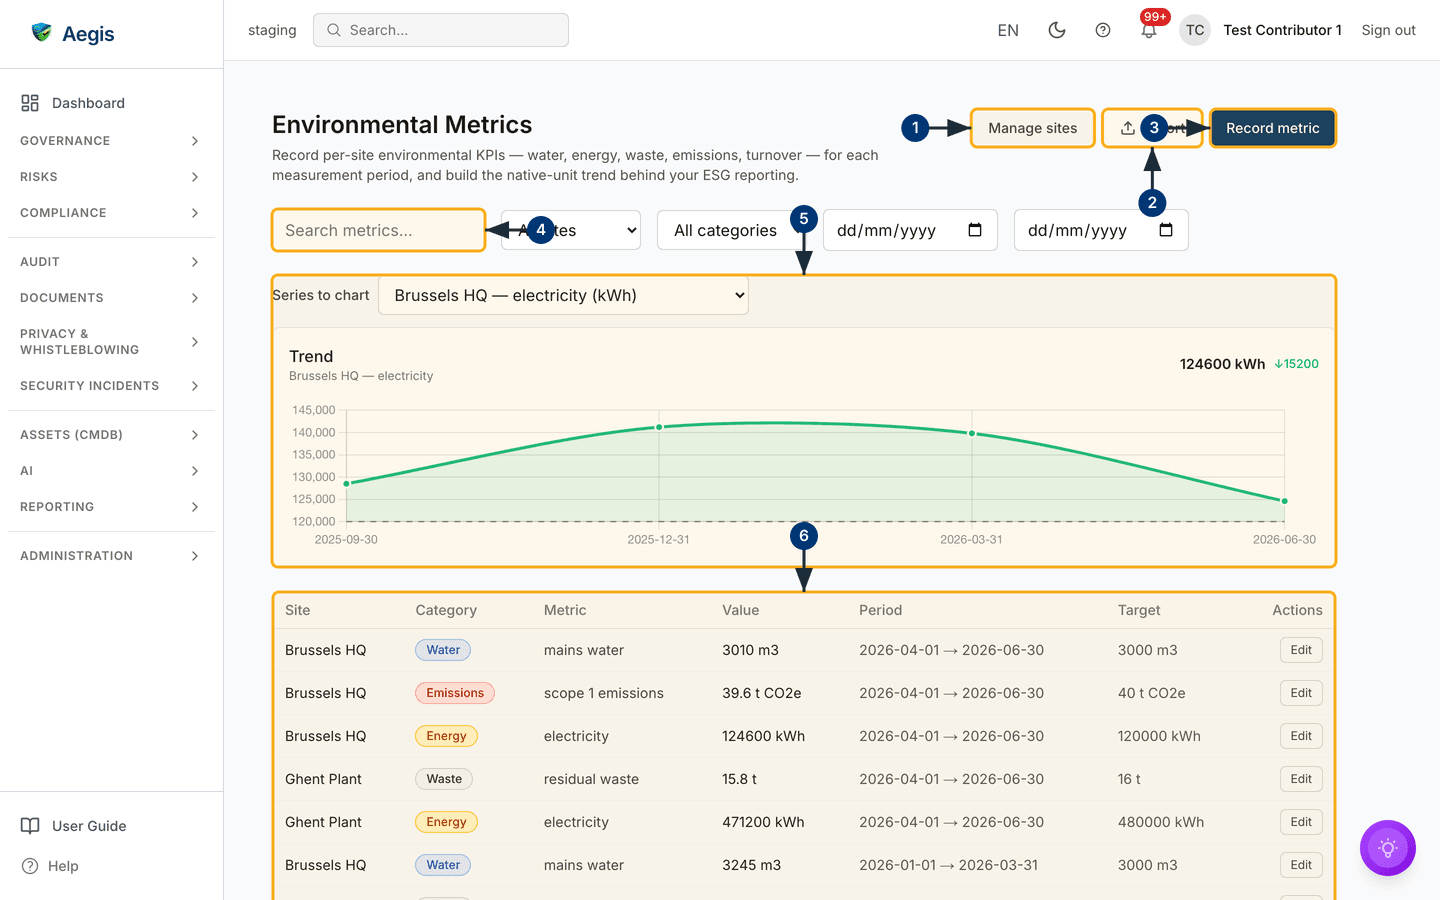
Top right sit the three working buttons; below them a filter row; then the trend chart; then the metric table itself, with page controls underneath. The numbered landmarks:
-
Manage sitesopens the site list — the locations your metrics belong to. Add each plant or office once, with an optional code and country; everything else on the page keys off this list. A site that still has metrics cannot be deleted. -
Importopens the bulk importer for spreadsheet data — see the import section below. -
Record metricopens the form for a single measurement. -
The filter row: a search box, a site filter, a category
filter and a
From/Todate pair. Every list and chart below obeys them. -
The
Trendsection: pick a series withSeries to chartand Aegis draws its values over time, with a second line for the target where one is set. -
The metric table, one row per measurement:
Site,Category,Metric,Value(with its unit),Period,Targetand, for roles that may change data, a rowEditaction — a Manager or Admin also seesDelete.
Record a measurement
-
Select
Record metric. Pick theSite— if the list is empty, create a site first viaManage sites. -
Choose a
Category(Water,Energy,Waste,Emissions,TurnoverorOther) and type aMetric key— the series name, such aselectricity. Reuse the same key and unit each period; the trend chart joins measurements into a series by site, key and unit. -
Enter the
Value, itsUnit(kWh, m³, t …) and thePeriod startandPeriod endthe measurement covers — a month, a quarter or a year. -
Optionally set a
Targetin the same unit and say whether higher or lower is better, and add aNotefor context. Save — the row appears in the table and the series updates.
Import a spreadsheet
-
Select
Import, thenDownload templatefor the expected column layout — or use your existing workbook: the importer also reads matrix-style sheets (category blocks as columns, years as rows, one site per sheet) and can detect the layout automatically. -
Choose the file and select
Validate. Aegis reports how many rows are valid and lists each faulty row with its reason; unknown site names are flagged, with a tick-box to create them during the import. -
Select
Importto commit. Only valid rows are written; faulty rows are skipped and stay listed so you can fix the file and run it again.
Tips and limits
- Consistency beats precision. A trend only means something when the same series is measured the same way each period. Agree the metric keys and units once, then hold to them.
- Native units, no conversion. Aegis stores and charts what you enter. It does not convert kWh into CO₂ equivalents or aggregate across units — bring converted figures in as their own series if you need them.
- Measurement is not a report. This register feeds your ESG reporting; the written report itself is produced elsewhere.
Where this connects
- Reports and Board Reports — where the numbers recorded here end up in front of leadership.
- Risks — environmental findings that need managing belong in the risk register.
- Roles overview — who can record, import and delete, in full.