The audit log
A permanent, searchable record of who did what in Aegis, and when — the trail you reach for when an auditor asks a question or something on screen does not look right.
Everything that happens in Aegis is written to the
audit log (a record of every action that
touches the system). Whenever someone creates, edits or deletes a record,
changes a status, signs in, or even opens a page, an entry is written. The log
is always on, and no role escapes it — an administrator's actions are recorded
the same as anyone else's. You reach it from the sidebar under
AUDIT → Audit Log, or directly at /log.
Most compliance frameworks expect you to show who has access, what they did and when. ISO 27001 and NIS2 (a European cybersecurity law) both set out audit-logging requirements, and SOC 2 (a US assurance standard, on the Aegis roadmap rather than shipped) expects the same. Because Aegis records every action by design, the record is already there when someone asks — you search it rather than reconstruct it.
Who uses it
Reading the log is open to every role.
Viewer,
Contributor,
Manager and
Admin all hold the audit-read
permission, so all four can open /log, search it and filter it —
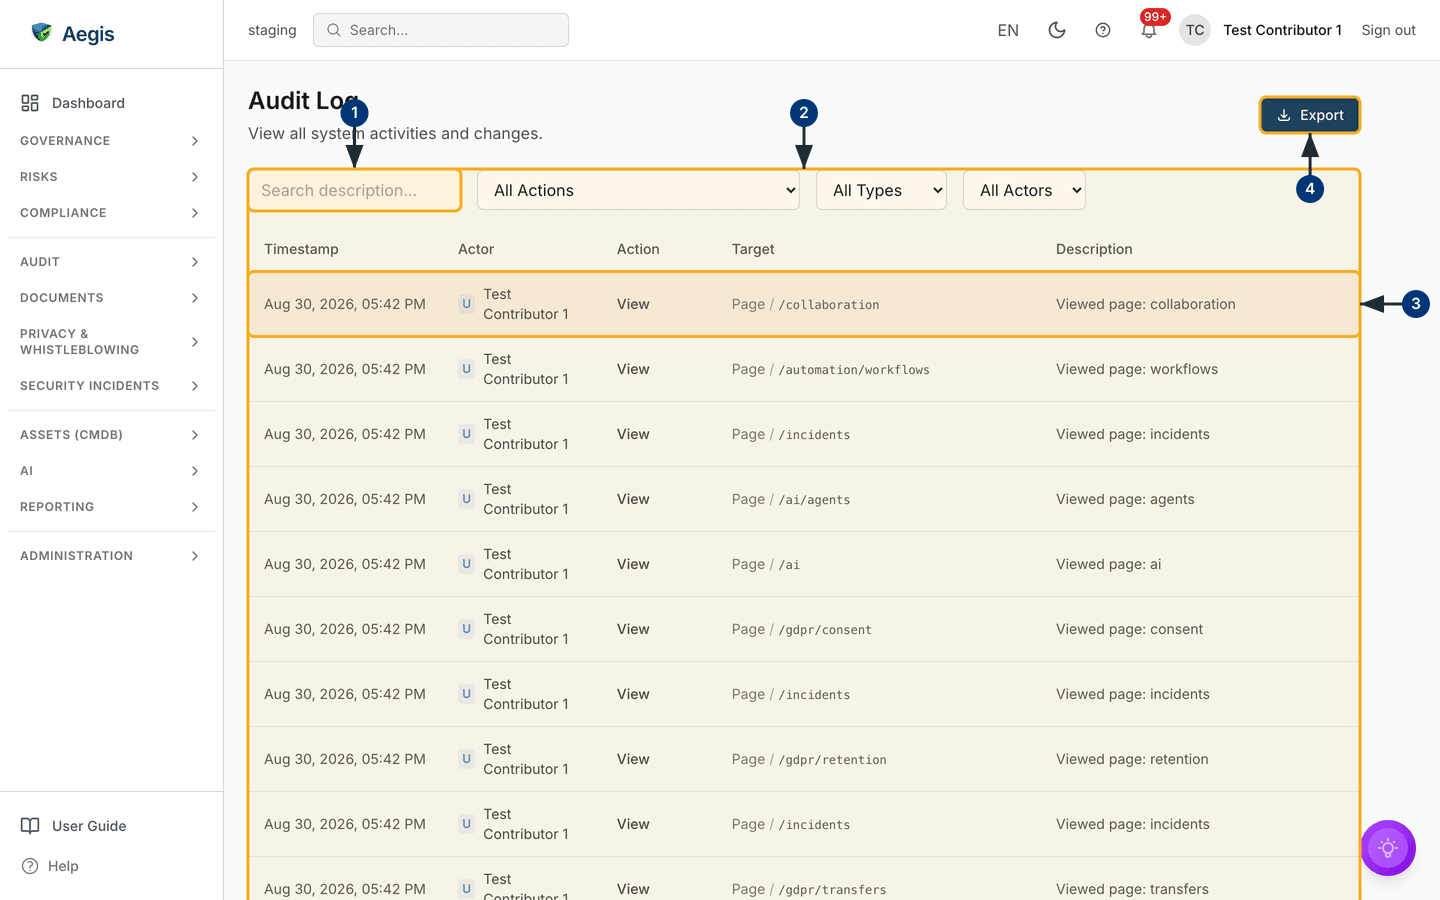
the screenshot below was captured by a Contributor. What nobody can do here is
change anything: the page is read-only for every role.
Downloading a copy is separate and licensed. The Export button is
rendered only when your plan includes audit export — the Professional and
Enterprise tiers — so on Essentials you see the full table but no download
button.
What's on this screen
The page opens on the whole log, newest entry first. Along the top sits the
heading
Audit Log with the line "View all system activities and changes.",
and — where your plan allows it — a dark Export button at the far
right. Directly beneath it is a row of four controls that narrow the list:
-
A search box marked
Search description.... It matches the Description column, ignores capitalisation, and runs a moment after you stop typing rather than on a button. -
All Actions— every action Aegis records. Ten everyday ones sit at the top, in this order:Create,Update,Delete,Login,Logout,View,Analytics View,Settings Update,Policy AcknowledgedandDocument Read. Every other registered action — exports, AI jobs, connector and provider events — follows below in alphabetical order. -
All Types— the kind of record affected:Policy,Risk,Vendor,Evidence,Procedure,Framework,User,Playbook,Analytics,PageandUnknown. -
All Actors— who or what acted: a person (User), the platform itself (System), a workflow, an API client, or a scheduled job (Scheduler). -
A
Clear filterslink appears at the end of the row as soon as any of the four controls holds a value, and resets them all in one go. With nothing set, it is not there.
The table below has five columns:
| Column | What it shows |
|---|---|
| Timestamp | The date and time of the action, shown in your own local time. |
| Actor |
Who acted, with a letter badge for the actor type —
U person, S system,
W workflow, A API, C
scheduler — then the name or email address.
|
| Action | What was done, colour-coded: green creates, amber updates, red deletes, blue sign-in and sign-out. The word carries the meaning; the colour only helps you scan. |
| Target |
The record affected: its type, a slash, then its name — for example
Policy / Access Control Policy. Where no name can be
resolved, the stored identifier appears in a monospaced font
instead, as in the screenshot's
Page / /gdpr/consent rows.
|
| Description | A one-line summary such as "Viewed page: consent", trimmed if it is long. |
Every row is clickable. At the foot is a pagination bar reading
Showing … to … of … entries, with
Previous, numbered pages and Next; the list loads 50
entries at a time. In the captured screen the log is a run of
View rows by Test Contributor 1 against
Page targets, seconds apart — what a fresh browse through the app
looks like, because Aegis records page views as well as changes. If nothing
matches, the table is replaced by the line
No audit log entries found. The figure in the next section shows
the whole screen, its four callouts matching the four steps above it.
Searching and filtering the log
Open /log from the sidebar. The search box and the three dropdowns
combine: set as many as you like and the list narrows to entries matching all of
them at once.
-
Type a word or two into the
Search description...box. A moment after you stop typing the table redraws with only the matching entries, and the count in the pagination bar drops to match. Clear the box to bring everything back. -
Narrow the list block further with the three dropdowns beside the search box
—
All Actions,All Types,All Actors. Each choice reloads the rows straight away and returns you to page one; usePreviousandNextat the foot of the block to move through older activity, andClear filtersat the end of the filter row to start again. - Read down the rows: time, actor, action, target and description, so a whole row reads at a glance. Select a row to open its full details.
-
Select
Exportat the top right to download what you are looking at. The file follows your active search and filters, so a table narrowed to deletions gives a file of deletions, and a message confirms the download.
Reading a single entry
Selecting a row opens a dialog headed Audit Log Details over the
list, setting out the entry field by field:
- Timestamp — the full date and time, in long form down to the second.
- Actor — the person's name, with their email address beside it in brackets where Aegis holds both. For a non-person entry the recorded actor name appears instead.
-
Actor Type — shown only when the actor was not a person, so
a
SYSTEM,WORKFLOW,APIorSCHEDULERentry declares itself. - Action, Target and Description — what was done, to which record, and the plain-language summary.
- IP Address and User Agent — the source address and the browser or client used, each shown only where Aegis captured it.
-
Payload — the extra data the action recorded, as indented
JSON (a machine-readable format). An edit lists the fields changed, often
with a
beforeandafterpair; a delete keeps the removed record's identifier and its name. It is a note of what changed, not a full copy of the record. Entries with no payload leave the field out. -
Entry ID — under a
Metadataheading, the unique reference for the entry itself. Quote it to point a colleague or support at one exact entry.
Close the dialog to return to the list with your filters still in place; if the
entry fails to load, the dialog shows the error with a Retry button
rather than closing on you. The payload is what makes the log useful after the
fact — a delete entry still names the record that was removed, and an edit entry
still names the fields that moved, after the record itself has gone. For the
record's full contents at that moment, go to the module's own history where it
keeps one.
Exporting a slice for an auditor
The Export button produces a CSV (spreadsheet) file named
audit-log- plus the date, with ten columns: timestamp, action,
target type and id, description, actor id, name and email, IP address and user
agent.
- Narrow the table first, until it shows exactly the activity you want to hand over. The export follows the same search and filters.
-
Select
Export. The button readsExporting...and is disabled while the file is prepared, then your browser downloads it. -
Read the message that appears.
Audit log exportedmeans the file holds every matching entry. APartial exportwarning means the result was too large, only the most recent entries were written, and it states how many of how many.
A truncated export looks like a complete one once it is on disk. If the
Partial export warning appeared, split the job by action, type
or period and export each part rather than passing on what you have.
The export is itself recorded in the log as an Export action, so
the fact that someone took a copy is part of the trail too.
Everyday uses
-
See every deletion. Set
All ActionstoDelete, then open a row to read its payload. -
Trace changes to one record. Set
All Typesto the kind of record, then search for its name — the search reads the Description column, and Aegis writes the name into it (Updated policy: Access Control Policy). -
Set page views aside. A busy log is mostly
Viewrows. Filter byCreate,UpdateorDeletefor changes only, or byAll Actors→Userto hide automation.
Tips and limits
- Read-only for everyone. There is no edit and no delete on this page, and no write route behind it. A lawful erasure request for a named person is an exceptional operation handled by your Aegis operator, not done from here.
- Filtering is by action, type and actor — not by date. The screen has no date-range control. To slice a log by period, export it and filter by the timestamp column in your spreadsheet tool.
- Target names are looked up, not stored. An entry keeps the record's identifier; the Target column reads the name from the record each time you open the page. A renamed record therefore shows its new name on old entries, and where there is no name to read — a page view, or a type Aegis does not resolve — the column falls back to the identifier.
- Retention. The log runs back to your tenant's first day and this page has no step to trim or purge it. Any retention rule beyond that is an operator decision at the database, not a setting here.
- Tamper-evidence is database-level. The log's integrity rests on there being no route to alter an entry. Aegis does not forward entries to an external write-once store from this page; if your framework asks for more, raise it with your Aegis operator.
Where this connects
The log records the actions of every role, so it sits alongside
What each role can do, which sets out who is
permitted to do what in the first place.
Anomalies watches the same activity for unusual
patterns; following its link to an entry opens this page scoped to that one
entry by the address, which the filter controls cannot widen — open
Audit Log from the sidebar again to come back to the whole log.
Audits and
Audit readiness are where an export from here
usually ends up. If something on this page does not behave as described,
Getting help explains how to reach support.