The Workflow Editor
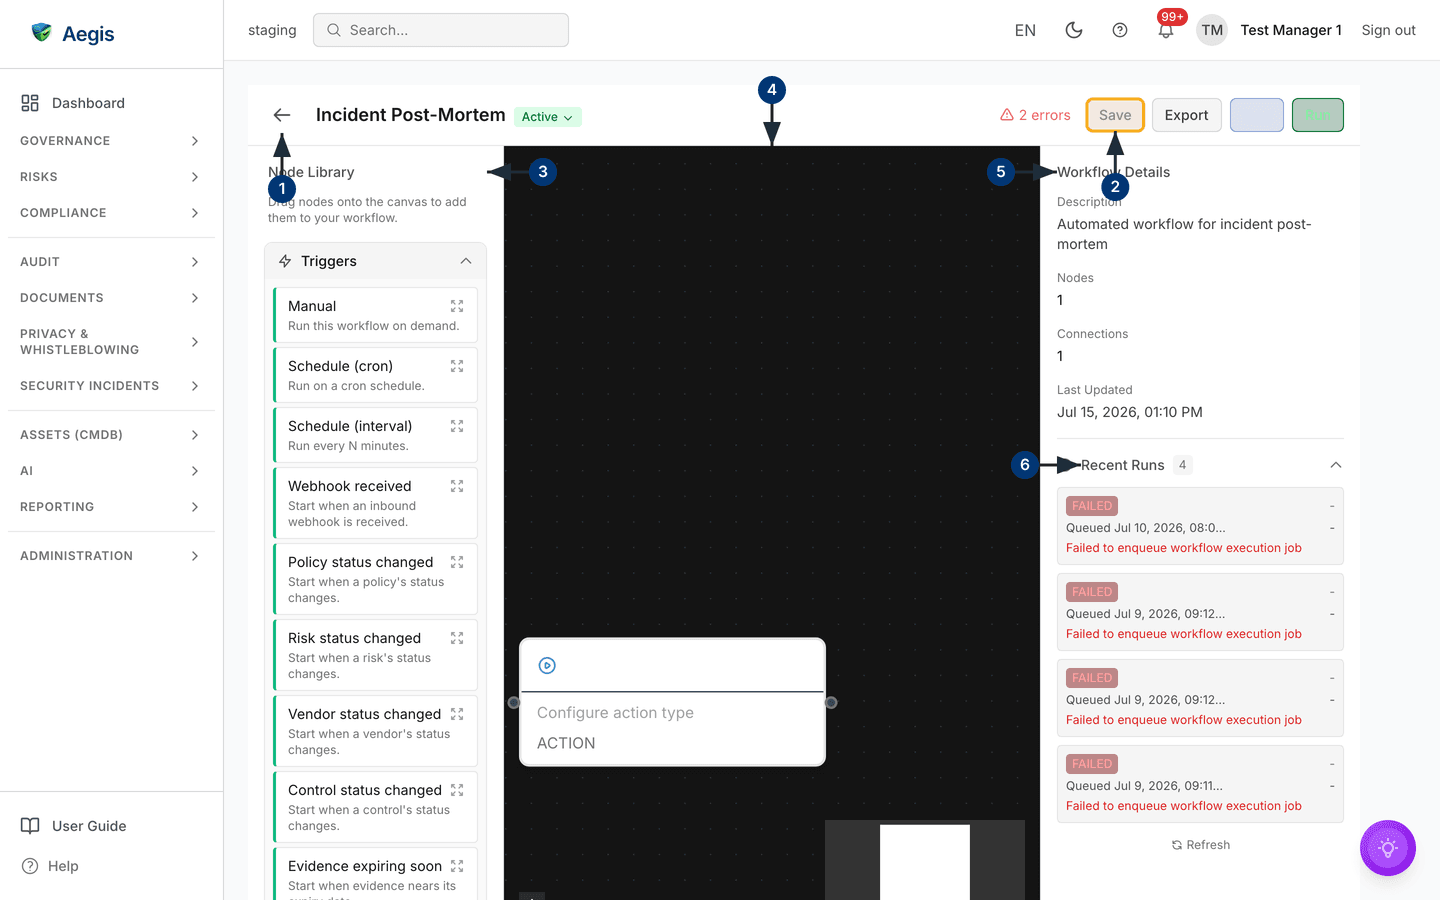
Every saved workflow opens onto its own full-screen canvas — this chapter walks that editor in detail: the toolbar, the node library, the two faces of the right panel, and how to read a run.
The Workflows chapter covers the list at
/automation/workflows, creating a workflow, the statuses and the
import/export round trip. This one goes deeper into the screen you spend the
time on: the editor at /automation/workflows/<id>, where the
logic is actually drawn. It is a three-panel screen — node library on the left,
canvas in the middle, a context panel on the right — under a toolbar that
carries the workflow's name, status and actions.
Who uses it
- Viewer and Contributor can open the editor and read everything, including the run history. The server refuses their saves, tests and runs.
- Manager and Admin edit, save, test, export, activate and run. The Workflows module and the Workflow Automation licence feature gate the whole area, as described in Workflows.
What's on this screen
-
The toolbar starts with a back arrow to the list, then the workflow's name —
select the name itself to rename it in place — and the status chip
(
Draft,Active,PausedorArchived). The chip is a dropdown: changing status happens here, not on a separate button row. -
The action buttons sit at the right:
Save,Export,TestandRun. Beside them the editor reports on itself — aSaving...orUnsaved changesindicator, and a red count such as2 errorsthat opens theValidation Errorslist.Runstays disabled until the workflow isActive. -
The left panel is the
Node Library— "Drag nodes onto the canvas to add them to your workflow." — in three collapsible groups:Triggers,ActionsandLogic. - The centre is the canvas. Each node is a card summarising its own configuration — or warning it is not configured yet. Drag from the handle on one node to the next to connect them; a minimap and zoom controls sit in the corners for large drawings.
-
The right panel follows your selection. With nothing selected it shows
Workflow Details: the description, the node and connection counts, and when the workflow was last updated. -
Below the details,
Recent Runslists the run history with aRefreshcontrol —No runs yeton a fresh workflow. Select a node on the canvas and the whole panel becomesNode Configurationinstead.
Configure the trigger
A workflow has exactly one trigger — the node the run starts from. Drag one in
from
Triggers and select it: the right panel becomes
Node Configuration, with the node's Label, its type,
and the fields that type needs.
-
Manual— "Run this workflow on demand." The one trigger type that is dispatched today (see the warning below). -
Schedule (cron)takes a cron expression and a timezone;Schedule (interval)runs every N minutes. -
Webhook receivedstarts when an inbound webhook arrives — the URL is generated once the workflow is saved. -
The entity triggers —
Policy status changed,Risk status changed,Vendor status changed,Control status changed— react to a status change on the named record type, andEvidence expiring soontakes aDays before expirythreshold.
As in the Workflows chapter: schedules,
webhooks and entity triggers can be drawn, configured and saved, but nothing
dispatches them yet. Until that changes, a person presses Run.
Add actions and logic
-
Drag an action in and configure it from its
Action Typedropdown:Send Email(recipients, subject, body),Send Webhook(URL, method, headers),Send Teams Message,Send Notification(an in-app notification), a status-setter for a policy, risk, vendor, control or procedure,Assign Owner,Create Audit Log,Enqueue JoborApproval Gate(pause for human approval). -
Use
ConditionfromLogicto branch on a field–operator–value test. A condition node has two outgoing handles — yes and no — and both must lead somewhere before the workflow validates. Chain condition nodes for compound logic. -
Use
Delayto wait — a fixed duration in minutes, hours, days or weeks, or until a date. Text and date fields accept placeholders in double braces, such as{{trigger.entity.dueDate}}; a value the run does not supply stays in the text as typed. - Watch the red error count as you build. It names what is missing — an unconfigured node, a dangling branch — and the workflow cannot be activated until the list is empty.
Test, run and read the history
-
Testis a dry run: it walks the graph without sending email or touching records, then reports passed or failed with any errors and warnings, each offering a jump to the node concerned. -
Runstarts a real run of anActiveworkflow. It lands at the top ofRecent Runswith its status and when it was queued. - Open a run to see the detail: when it was queued, started and completed, the trigger type, any error message, and a node-by-node breakdown with each node's input and output — the first place to look when a workflow did not do what you expected. A rerun control repeats the workflow from here.
Failed runs say why in red on the run card itself — for example a run that could not even be queued. That message is the difference between "the logic is wrong" and "the logic never got to start", so read it before editing the drawing.
Tips and limits
-
Canvas edits save themselves about two seconds after you stop, with
Saving...shown meanwhile;Savewrites immediately. Either way, wait for the indicator to clear before closing the tab — a pending change is lost. -
Exportproduces the workflow as JSON — useful as a backup before a big edit, or to copy a workflow between environments withImporton the list page. -
A run acts with the workflow's own authority, not the presser's. Prefer
changing the status chip to
PausedoverArchivedfor a workflow you may want back soon — both stop it, but a paused workflow reads as temporarily off.
Where this connects
- Workflows — the list, creating a workflow, statuses, import and export.
- Auto-Incident Rules — the other automation surface, turning connector events into incidents.
- Connectors — where Teams, webhook and email delivery are configured.
- Audit Log — where workflow changes and runs leave their trail.