Reports
Compose your own page of compliance data — charts, tables, single numbers, filters and text on one saved layout you can reopen, export and hand to a colleague.
The dashboard answers a fixed set of questions. Sometimes the question is yours. A report in Aegis is a page you build: a saved arrangement of widgets (the individual boxes — a chart, a table, a number, a filter, a block of text) placed on a grid. Each widget queries the database every time the report is opened, so the figures are current rather than frozen on the day the report was written.
Who uses it
Four permissions govern this module and they do not line up in one ladder. A Contributor can build a report but cannot export it; a Viewer can export one but cannot open the builder at all.
| Role | See the list | Open the builder | Create and save | Export | Delete |
|---|---|---|---|---|---|
| Viewer | Yes | No | No | Yes | No |
| Contributor | Yes | Yes | Yes | No | No |
| Manager | Yes | Yes | Yes | Yes | Yes |
| Admin | Yes | Yes | Yes | Yes | Yes |
What the list contains also depends on your role. An
Admin or
Manager sees every report on the
tenant; everyone else sees their own plus any report marked as a shared
template. Opening /reports/builder without create permission sends
you to the /unauthorized page rather than to a canvas whose
Save would fail.
What's on this screen
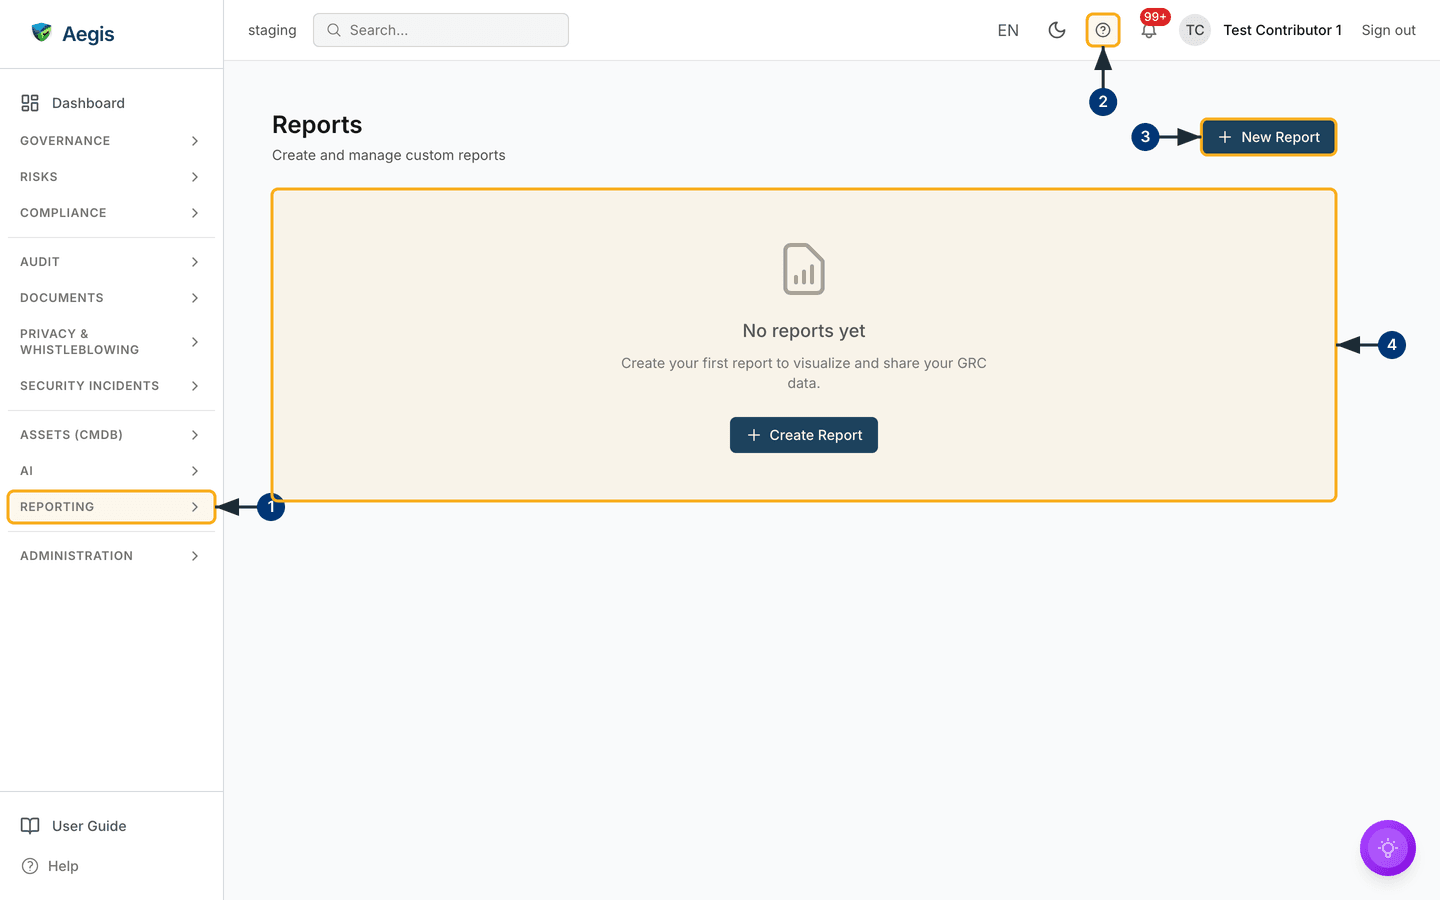
Reports sits at /reports, inside the REPORTING group
in the left sidebar — near the bottom of the menu, below
ASSETS (CMDB) and AI. Across the top runs the
application bar: the environment name (staging in the capture
below), the search box, the language switch EN, the light/dark
moon, the help ?, the notifications bell, and your signed-in name
with Sign out.
The page itself is deliberately plain. The header reads
Reports over the line Create and manage custom reports,
with one primary action — New Report — at the top right. There is
no filter bar, no in-page search and no tabs; the header sits directly above the
list.
Once you have saved something, the body becomes a table of five columns:
Name, Description (reading
No description when blank), Created,
Updated and Actions. The Actions cell
holds up to five controls, each shown only if your role holds the matching
permission: a pencil that opens the builder, buttons labelled PDF,
XLSX and CSV, and a trash can.
In the capture below the tenant has no saved reports, so the table is replaced
by the empty state: a document icon, the heading No reports yet,
the line
Create your first report to visualize and share your GRC data. and a
second Create Report button. A role without create permission sees
No reports have been created yet. and no button.
-
Expand the
REPORTINGgroup in the left sidebar and selectReports. The page opens at/reportswith the header and the list area beneath it. -
The help
?in the application bar leaves Reports and opens this guide at the chapter for the screen you were on. Your signed-in name andSign outsit to the right of it. -
Select
New Reportat the top right. The report builder opens at/reports/builderwith an empty canvas and the nameUntitled Report. -
On a tenant with no reports, the centre of the page shows the
No reports yetpanel with its ownCreate Reportbutton. Either button starts the same blank report.
Starting from a template
Aegis ships six built-in templates — Executive Summary,
Compliance Status, Risk Overview,
Vendor Assessment, Incident Summary and
Audit Trail Report — each a ready-made arrangement you can then
change. This guide has no capture of the builder; the steps below name its
controls exactly as they are labelled on screen.
-
In the builder toolbar, select
Templates. A dialog headedChoose a Templateopens with a search box, category buttons starting atAll Templates, and the templates as cards with aBlank Reportcard first. -
Select a template card. The dialog closes, the canvas fills with its
widgets, the report takes the template's name and description, and the
toolbar shows
Unsaved changes— nothing has been written yet. TheBlank Reportcard closes the dialog and leaves the canvas as it was. -
Select
Save. The report is created and the address gains its identifier (/reports/builder?id=…), which you can bookmark or pass to a colleague.
Adding and configuring widgets
The builder has three fixed regions: a toolbar across the top carrying the
report name, the
Unsaved changes marker and the Templates,
Preview, Export, Reset and
Save buttons; the Widget Library panel down the left,
under the line Drag widgets onto the canvas or click to add; and a
twelve-column grid canvas filling the rest. An untouched canvas reads
Empty Report over
Drag widgets from the library panel on the left to build your report. A
fourth panel — the widget configuration — opens along the right edge, but only
while a widget is selected.
-
Select the report name in the toolbar and type over it. A new report starts
as
Untitled Report; give it a name a colleague will recognise and pressEnter.Escapeabandons the edit and keeps the old name. -
In the
Widget Librarypanel, select a widget type or drag it onto the canvas. A widget with default settings appears and the toolbar switches toUnsaved changes. -
Select the widget on the canvas. A panel headed
Configure Widgetopens along the right edge, showing theTitlefield, the fields for that widget type and a trash can. It closes again when no widget is selected. -
Set the data source and options. For a chart, choose
Data Sourcefirst — theGroup Bylist is rebuilt from that choice, so after changing the source you need to pick a grouping again from the new list. - Drag the widget by its title bar to move it, or its bottom-right corner to resize it. Other widgets shuffle aside rather than overlapping.
-
Select
Save. The button stays inert until something has changed, so a greyed-outSavemeans nothing is outstanding.
The library offers five widget types:
| Widget | What it shows | Main settings |
|---|---|---|
Chart |
A bar, line, pie, doughnut or radar chart |
Chart Type, Data Source,
Group By, Aggregation, Colors
|
Table |
Rows from one data source |
Data Source, Columns,
Sort By, Sort Order,
Rows Per Page, Show pagination
|
KPI |
One number — a KPI (a headline
measure such as Open Risks)
|
Metric, Variant (colour) |
Filter |
A control that narrows other widgets on the same page |
Filter Type (Single Select,
Multi Select, Date Range),
Field, Label,
Options
|
Text |
Headings and narrative beside the data |
Content, Format (Markdown or
Plain Text), Text Size,
Alignment
|
Charts and tables draw on eight sources: Risks,
Policies, Vendors, Framework Controls,
Compliance Scores, Evidence,
Procedures and Environmental Metrics. The KPI
Metric list reaches further, adding incidents (including
Avg. Resolution Time (hours)), audit events, active users, login
events and the recorded environmental totals for energy, water and waste.
The builder does not save as you go. While edits are outstanding the toolbar
shows
Unsaved changes beside a Reset button, which
discards everything back to the last save. Closing the tab without saving
loses the work.
Removing a widget
-
Select the widget on the canvas, then the trash can — on the widget's own
header or at the top of the
Configure Widgetpanel. PressingDeleteorBackspacewith the widget focused does the same. All three open one confirmation. -
A dialog headed
Delete Widgetasks Remove this widget from the report? You can restore it with Reset until you save. Confirm to remove it;Resetbrings it back until you save.
Previewing and exporting
Preview opens the report as a reader will see it: a full-screen
dialog headed with the report's name, noting
Preview mode - This is how your report will appear when exported.
Inside it the report is drawn as a white page — the name, the description, a
generated-on date, then the widgets stacked one under another in layout order
(top row first, left to right), and the footer
Generated by Aegis GRC Platform. Charts, tables, KPIs and text are
rendered with live data; a filter widget is not, and shows
Unknown widget type instead, so a report built around filters
previews and exports without them. No editing controls are shown. Select
Close Preview to return to the builder.
Export in the toolbar offers Export as PDF,
Export as Excel and Export as CSV. It appears only for
a role holding export permission, so a
Contributor will not see it,
and an unsaved report prompts you to save first. The same three formats sit on
the list page as the PDF, XLSX and
CSV buttons — the route a
Viewer uses, since the builder is
closed to them. If an export started from the list fails, the message
Could not export the report
appears and nothing downloads; the same failure in the builder raises a browser
alert instead.
Reopening and editing a saved report
-
On the Reports page, select the report's name, or the pencil in its
Actionscell. The builder opens with that report loaded and noUnsaved changesmarker. A role without create permission sees the name as plain text and has no pencil. -
Add, remove or reconfigure widgets, then select
Save. TheUpdateddate on the list moves to today, and the next person to open the report sees the new version.
Deleting a report
-
On the Reports page, select the trash can in the report's
Actionscell. The icon is present only for a Manager or Admin. - A confirmation dialog asks Are you sure you want to delete "…"? with the report's name. Confirm to remove it, or cancel to keep it.
Confirming removes the report and its layout, and the removal is written to the audit log. There is no recycle bin — check that no one relies on the report first.
Tips and limits
-
A widget only shows data you are allowed to read: every request carries the
read permission of the source's own module, so a
Risks chart is refused for someone without risk
access. A refused or failed widget reads
Unable to load data. -
A widget reading
No data availablemeans the source holds no matching records rather than a fault. Clear any filter on the page and check the source module holds data on your tenant. -
Columnson a table widget is typed as comma-separated field names, and a name outside the allowed list for that source is dropped; if none of the names survive, the widget falls back to every column that source allows. A text widget renders headings, bold, lists and links only when itsFormatis set toMarkdown. - There is no per-report sharing control and no per-report permission — access follows the module and the four permissions in the table above. If you need a report restricted to a smaller group, speak to your administrator; the platform does not offer that today.
- Reports are built and exported on demand. Scheduled delivery of a saved report is not available from the interface at present.
- The builder has no AI assistance: every widget is one you choose and configure. For an AI-drafted narrative aimed at a board, see Board reports, where a person reviews and approves the text before it goes anywhere.
Where this connects
Board reports are the narrative alternative to a widget layout. The figures your widgets draw on come from Risks, Policies, Vendors, Evidence, Procedures, Incidents and Compliance frameworks. For ready-made charts, see Analytics and Benchmarking; for the permissions behind the table above, Roles and permissions.