Customer Satisfaction
Record how satisfied your customers are — survey results, NPS campaigns, support-ticket ratings — and watch the trend over time, so the quality of your service is measured rather than assumed.
ISO 9001 (the international quality-management standard) asks an organisation to monitor how well it meets customer expectations — clause 9.1.2, customer satisfaction. This page is that register: each entry is one satisfaction measure (a single measurement of customer satisfaction over a defined period, such as one quarterly survey), and Aegis normalises every entry to a common 0–100 scale so different metrics can share one trend line. The trend and its summary figures are the input your management reviews draw on.
Who uses it
- Viewer can open the page, read the trend and every recorded measure. No buttons to change anything appear.
- Contributor can also record new measures and edit existing ones — but not delete them.
-
Manager and
Admin have the full set,
including
Deleteon each card.
The page belongs to the Compliance module; if that module is not provisioned the menu entry is hidden.
What's on this screen
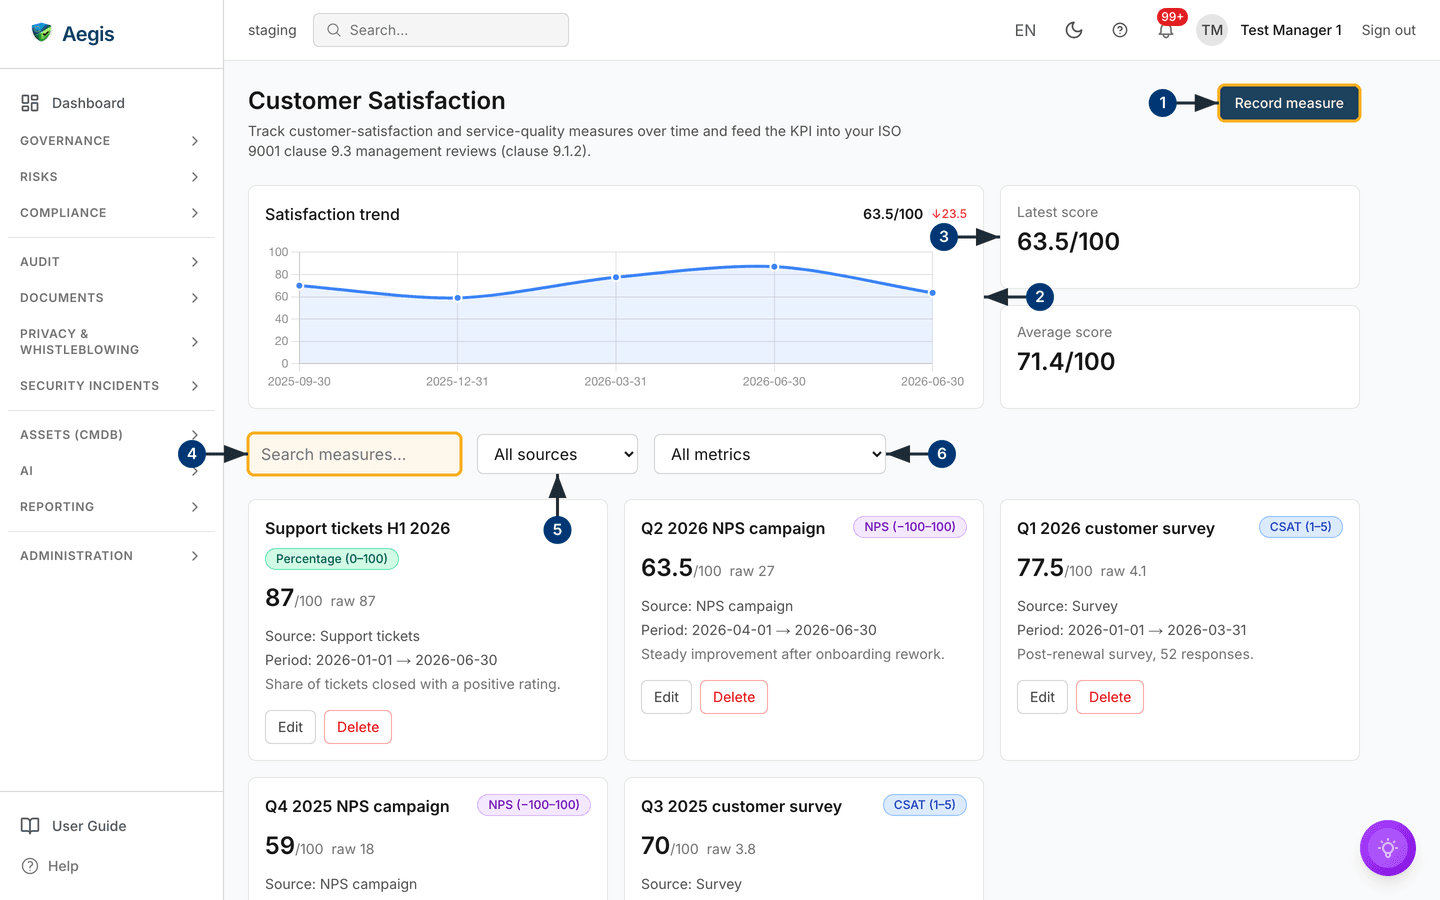
The page is headed Customer Satisfaction with a one-line reminder
of what it feeds. Everything else falls into three bands: the overview (chart
plus two figures), a filter row, and the measures themselves as a grid of cards.
There is no table here — each measurement is a card that carries everything
about it.
-
Open
Governancein the left menu and chooseCustomer Satisfaction. If you can record measures,Record measuresits in the top-right corner. -
The
Satisfaction trendchart plots every measure on the shared 0–100 scale in period order, whatever metric each one used. One glance shows direction; hover a point for the underlying entry. -
Beside the chart, two cards give the headline figures:
Latest scoreandAverage score, both as a mark out of 100. Search measures...narrows the grid by label as you type.-
All sourcesrestricts the grid to one source —Survey,NPS campaign,Support tickets,Review,IntervieworManual entry. -
All metricsrestricts it to one score type. Each card below shows the normalised score large, the raw score small, the source, the measurement period and any note;EditandDeleteappear according to your role. The grid pages at twenty cards.
Record a measure
One entry is one measurement over one period — a quarterly survey result, a month of ticket ratings, one NPS campaign. Enter results at whatever rhythm you gather them; the chart does the joining up.
-
Select
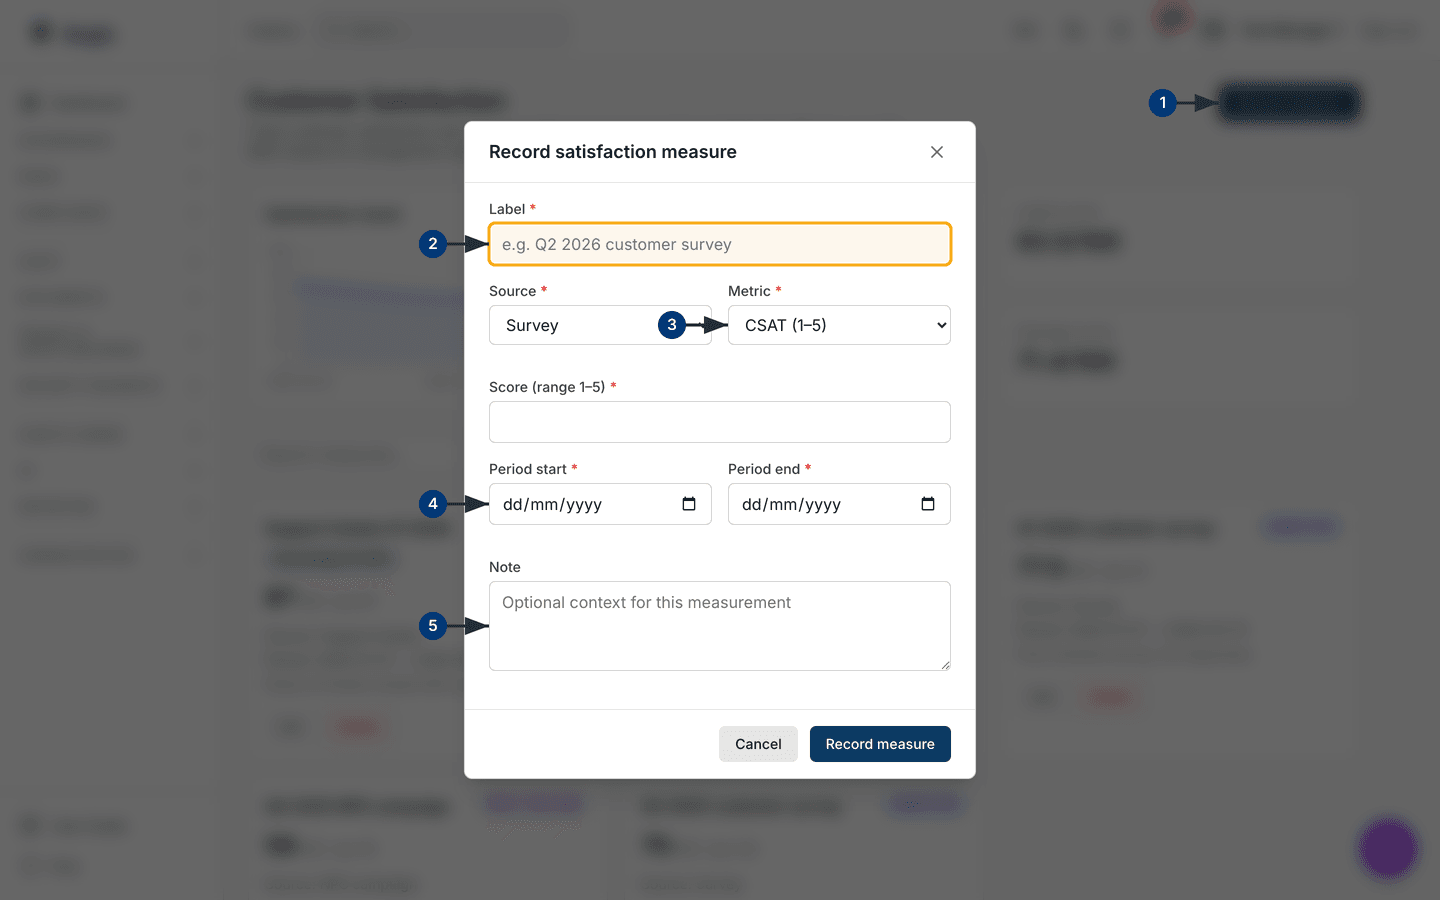
Record measure. TheRecord satisfaction measuredialog opens. -
Give the measure a
Labelyou will recognise later — the placeholder suggests "e.g. Q2 2026 customer survey" — and pick theSourceit came from. -
Choose the
Metricand enter theScore. The score field states the allowed range for the metric you picked, and a value outside it is rejected with a clear message. -
Set
Period startandPeriod end— the stretch of time the measurement covers, not the day you typed it in. The end date must not precede the start. -
Add an optional
Notefor context (sample size, campaign, caveats), then selectRecord measure. The dialog closes and the new card, chart point and headline figures all refresh together.
The metrics and how they normalise
| Metric | Raw range | Reads as |
|---|---|---|
CSAT (1–5) |
1 to 5 | Classic satisfaction rating; 5 is best. |
NPS (−100–100) |
−100 to 100 | Net Promoter Score from a would-you-recommend campaign. |
Percentage (0–100) |
0 to 100 | Any share expressed as a percentage, such as positive ticket ratings. |
CES (1–7, lower is better) |
1 to 7 | Customer Effort Score — Aegis inverts it, so low effort scores high. |
Scale (1–10) |
1 to 10 | A general ten-point rating. |
Every raw score is converted onto the same 0–100 scale before it reaches the chart and the headline cards. That is what lets a CSAT of 4.1 and an NPS of 27 sit on one line — and why each card shows both the normalised figure and the raw one underneath.
Edit or delete a measure
-
Select
Editon a card. The same dialog opens headedEdit satisfaction measure, pre-filled; change what you need and selectSave. -
Select
Delete(Manager and Admin only). A confirmation names the measure and warns the action cannot be undone; confirm to remove it. The chart and averages recalculate at once.
Tips and limits
- Entry is manual. Aegis does not run surveys or pull scores from a survey tool — someone records each result. A steady rhythm (per quarter, per campaign) makes the trend honest.
- Pick the metric that matches how the number was gathered rather than converting it yourself — the normalisation is consistent only when the raw score and its type agree.
- The management-review screen shows this KPI with a copy control, so the current figure can be quoted directly as review input. Deleting old measures changes history — prefer a correcting edit with a note.
Where this connects
- Governance Bodies — the boards and committees whose reviews consume this KPI.
- Analytics — the wider posture metrics this sits alongside.
- Reports — packaging figures like this one for a wider audience.