Incident reporting deadlines
A manager's dashboard that gathers every outstanding regulatory notification deadline across your incidents into one countdown list.
When a security incident may also be a reportable event under law, the clock
starts at detection. NIS2 (a European
cybersecurity law) expects an early warning within 24 hours, a fuller
notification within 72 hours and a final report within a month.
GDPR (the European data-protection law)
expects a personal-data breach to reach the supervisory authority within 72
hours. DORA (the European rules for
financial-sector operational resilience) adds initial, intermediate and final
reports for major ICT incidents. The Incident Reporting Dashboard at
/incidents/reporting collects those obligations and counts each one
down.
This screen tracks. It does not log incidents and it sends no notifications: you record the incident, decide whether it is significant and mark a notification as sent on the incident itself — see Incidents. Here you watch all of those clocks at once and step into whichever one needs attention.
Who uses it
-
Viewer and
Contributor — no access.
The
Reportingentry is hidden from their left menu, and typing/incidents/reportinginto the address bar sends them back to/incidents. Day-to-day incident logging does not need this page. - Manager — full access. This is the intended reader: the person accountable for meeting notification deadlines.
- Admin — full access.
The route checks the INCIDENT_READ permission, then confirms the
role is Manager or Admin; if either check fails you are redirected to the
incident list rather than shown an error. The data also requires the
Incidents module to be active for your organisation.
What's on this screen
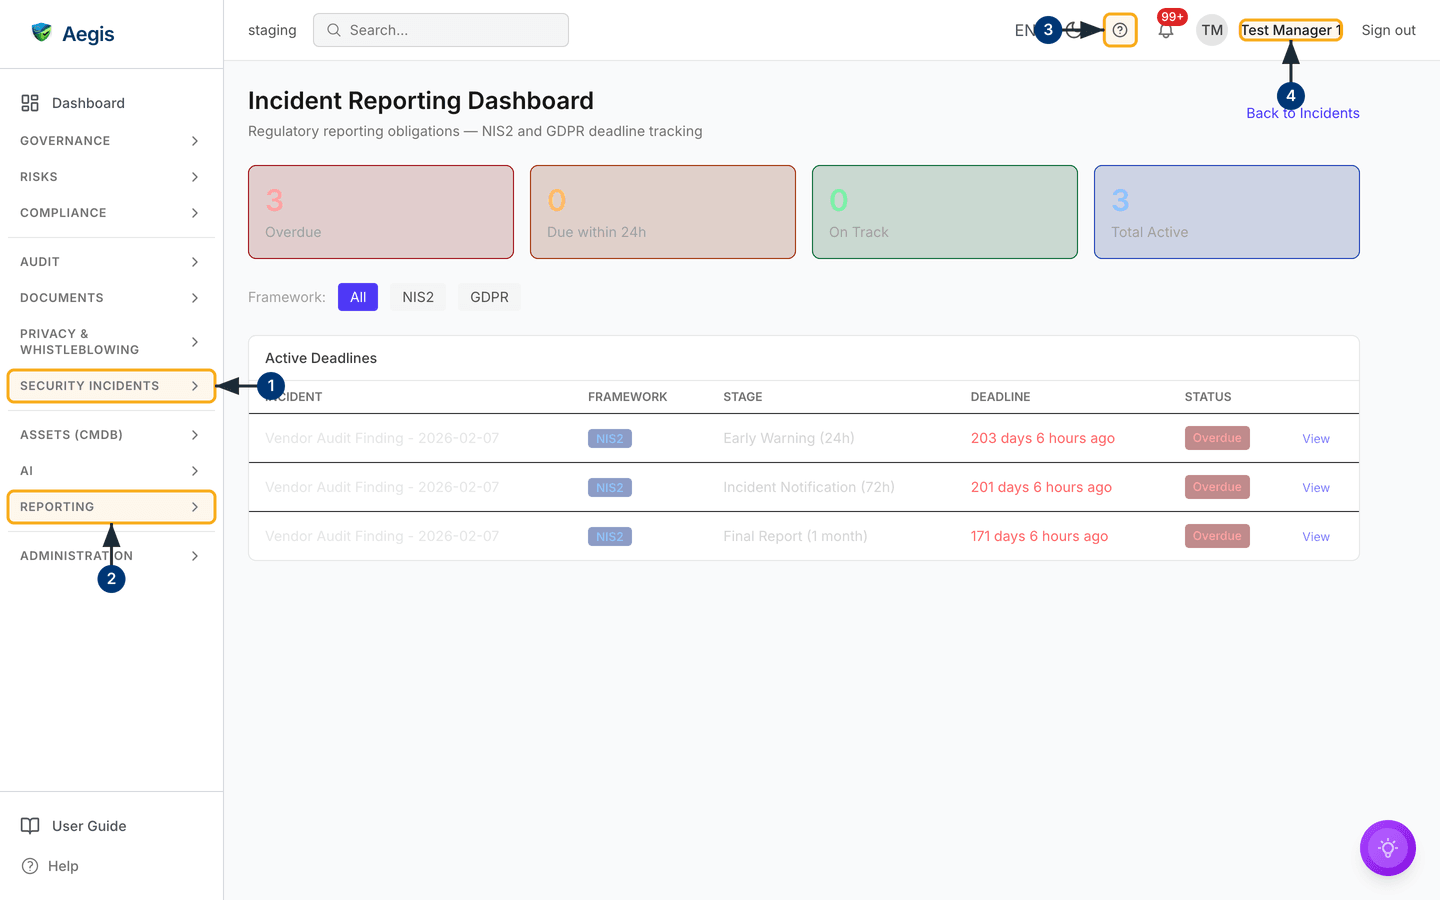
The dashboard fills the main area to the right of the left menu. At the top, the
heading
Incident Reporting Dashboard sits above the sub-line
Regulatory reporting obligations — NIS2 and GDPR deadline tracking,
with a Back to Incidents link on the far right.
Below the heading are four summary cards, each a large number over a label:
Overdue (red), Due within 24h (orange),
On Track (green) and Total Active (blue). In the
demonstration tenant captured below they read 3, 0, 0 and 3 — three obligations,
all of them already past their date.
Under the cards is a row labelled Framework: with three buttons —
All, NIS2 and GDPR — the selected one
filled in indigo. Then comes the Active Deadlines panel: a table
with the columns INCIDENT, FRAMEWORK,
STAGE, DEADLINE and STATUS, plus an
unlabelled final column holding a View link on every row. The
incident name and the View link both open that incident's detail
page.
In the capture the three rows all belong to one seeded incident,
Vendor Audit Finding - 2026-02-07, and show its three NIS2 stages —
Early Warning (24h), Incident Notification (72h) and
Final Report (1 month) — each with a red overdue age such as
199 days 6 hours ago and a red Overdue chip. That is
demonstration data, not a real backlog.
Nothing else is on the page: no export, no bulk action and no way to record a
notification from here. A Completed Notifications panel appears
below the table once at least one obligation has been fulfilled; there are none
in this capture, so the page ends at the table.
Open the dashboard
-
In the left menu, open the
SECURITY INCIDENTSgroup and chooseReporting(or type/incidents/reportingstraight into the address bar). The dashboard loads with the four summary cards, the framework buttons and theActive Deadlinestable. -
Note that the separate
REPORTINGgroup further down the menu is for cross-module reports and board packs — this deadline view does not live there. See Reports for that group. -
Select the help
?in the top bar to open the in-app guidance for the screen you are on. -
Check the name in the top-right corner. Only a Manager or an Admin sees this
page; a Viewer or Contributor has no
Reportingentry in the menu and is returned to/incidentsif they type the address.
Read the summary cards
The four cards answer the first question: how bad is it right now?
| Card | What the count means |
|---|---|
Overdue |
Obligations whose date has passed with no notification recorded. Work these first. |
Due within 24h |
Obligations falling due in the next 24 hours. |
On Track |
Everything else — not overdue and more than 24 hours away. |
Total Active |
Every outstanding obligation combined — the sum of the other three cards. |
One incident can contribute several rows and several counts: an incident that is both a NIS2 significant incident and a GDPR breach produces a deadline for each framework and each stage — which is why one seeded incident fills all three rows above.
The cards split into overdue, within 24 hours and everything else. The
STATUS chip in each row is finer: Overdue,
Urgent (within 24 hours), Due Soon (within 72
hours) and On Track (more than 72 hours away). A deadline two
days out therefore counts towards the green On Track card while
its row reads Due Soon. Read the row when you plan the work.
Filter by framework
-
Select
NIS2to narrow the table to NIS2 obligations, orGDPRfor the 72-hour authority notifications that follow a personal-data breach. The button you choose fills in indigo and the table redraws immediately. -
Select
Allto return to the combined view. If the chosen framework has no outstanding obligations, the panel shows a short "no deadlines" line in place of the table rather than an empty grid.
The filter changes the two tables only — the summary cards always count every
active obligation. Only NIS2 and GDPR have buttons. DORA stages for major ICT
incidents appear under
All but cannot be isolated here; use
DORA for that module's own view.
Work an overdue deadline
-
Read the
STATUScolumn and start at the top. The table is sorted by urgency, so the most pressing obligation is always the first row. -
Read
STAGEandDEADLINEtogether to see which notification is due and by how far it is ahead or behind — for exampleEarly Warning (24h)and199 days 6 hours ago. -
Select the incident name, or the
Viewlink at the end of the row, to open that incident's detail page in the same tab. - On the incident, record what actually happened: use the GDPR notification action for a data breach, or the NIS2 significance assessment and its stage actions for a NIS2 obligation. See Incidents for both flows.
-
Return to the dashboard. Once a notification is recorded against the
incident, that row leaves
Active Deadlinesand reappears underCompleted Notifications.
Review completed notifications
The Completed Notifications panel is only rendered when at least
one obligation has been fulfilled for the current framework filter, which is why
it is absent from the capture above. When it is there, the header reads
Completed Notifications followed by the count in brackets; select
it to expand the panel. Each row lists the incident, the framework, the stage,
Sent At, Sent To (a dash when no recipient was
recorded) and a status of On Time or Late. Rows are
ordered most recent first. This is the record to reach for when an auditor asks
what was reported, to whom and when.
The deadline banner follows you around
When an obligation is overdue or within 24 hours, Managers and Admins see a coloured banner at the top of every Aegis page, not only this one. It names the most urgent obligation and offers links to the affected incident and back to this dashboard. Dismissing it hides it for 30 minutes in that browser tab; it returns while the deadline is still open. Viewers and Contributors never see it.
The AI assist
This dashboard does no AI work of its own — it counts deadlines that already exist. The AI step happens earlier, on the incident: when you assess whether an incident is a NIS2 significant incident, Aegis can offer a likely-significant verdict with its reasoning and a confidence score. A person reviews that suggestion and decides. Recording the decision as significant is what creates the NIS2 deadlines you then see here. The AI never marks an incident significant on its own, and it never sends a notification.
Tips and limits
- A deadline only appears once the matching flag is set on the incident: a NIS2 significance decision, the data-breach flag for GDPR, or a major DORA classification. A serious incident with none of those set will not show here.
- Closing an incident does not clear its obligations. This dashboard reads the flags and the sent dates, not the incident status, so an unrecorded notification on a closed incident keeps its row here until you record it. The site-wide banner behaves differently — it considers only incidents that are still open.
- The list refreshes about once a minute, so countdowns stay current while the screen is open.
- Counts in a demonstration tenant are illustrative — read your own tenant's numbers rather than the ones in the figure above.
- There is no export from this screen; for an audit or board-pack summary, use Reports.
Where this connects
- Incidents — log incidents, run the NIS2 significance assessment and record notifications. Every deadline on this dashboard starts there.
- GDPR — the data-protection workspace behind the 72-hour breach notification.
- DORA — the financial-sector module whose major ICT incidents add their own reporting stages.
- Automatic incident rules — admin rules that open incidents from connected signals.
- Scenario: handling a security incident — the journey end to end, from detection to closure.
- Compliance frameworks — the NIS2 and GDPR controls these notification duties sit within.