CMDB and machine inventory
A compliance-focused register of the machines your organisation operates, with each asset tied to the risks, incidents and change history that depend on it.
CMDB stands for configuration management database — a record of the technology assets you run. It does not replace a full IT operations tool; it gives the compliance team a curated view of the machines that matter for security and audit work, so you can answer questions such as “which machines carry an open risk?”. You build the register by hand, or pull computer accounts in from Active Directory (a Microsoft directory of users and machines) where your operator has configured a connection.
Who uses it
What you can do here follows your role, and the header buttons change with it.
-
Viewer — browse the inventory
and read every tab. No adding, editing or deleting; but a Viewer holds the
report-export right, so the
Exportbutton is available. - Contributor — everything a Viewer reads, plus add a machine, edit it and change its status. No delete, no directory import and no export right — which is why the Contributor view below carries two header buttons, not three.
- Manager and Admin — the same create and edit rights, plus export, the Active Directory import, and delete from the bulk-actions toolbar.
Import from AD is shown to anyone who may create machines, but
listing the directory connections and running the import each need rights a
Contributor does not hold. A Contributor who opens the dialog sees “Failed
to load AD connections”. Ask a Manager or an Admin to run it.
What's on this screen
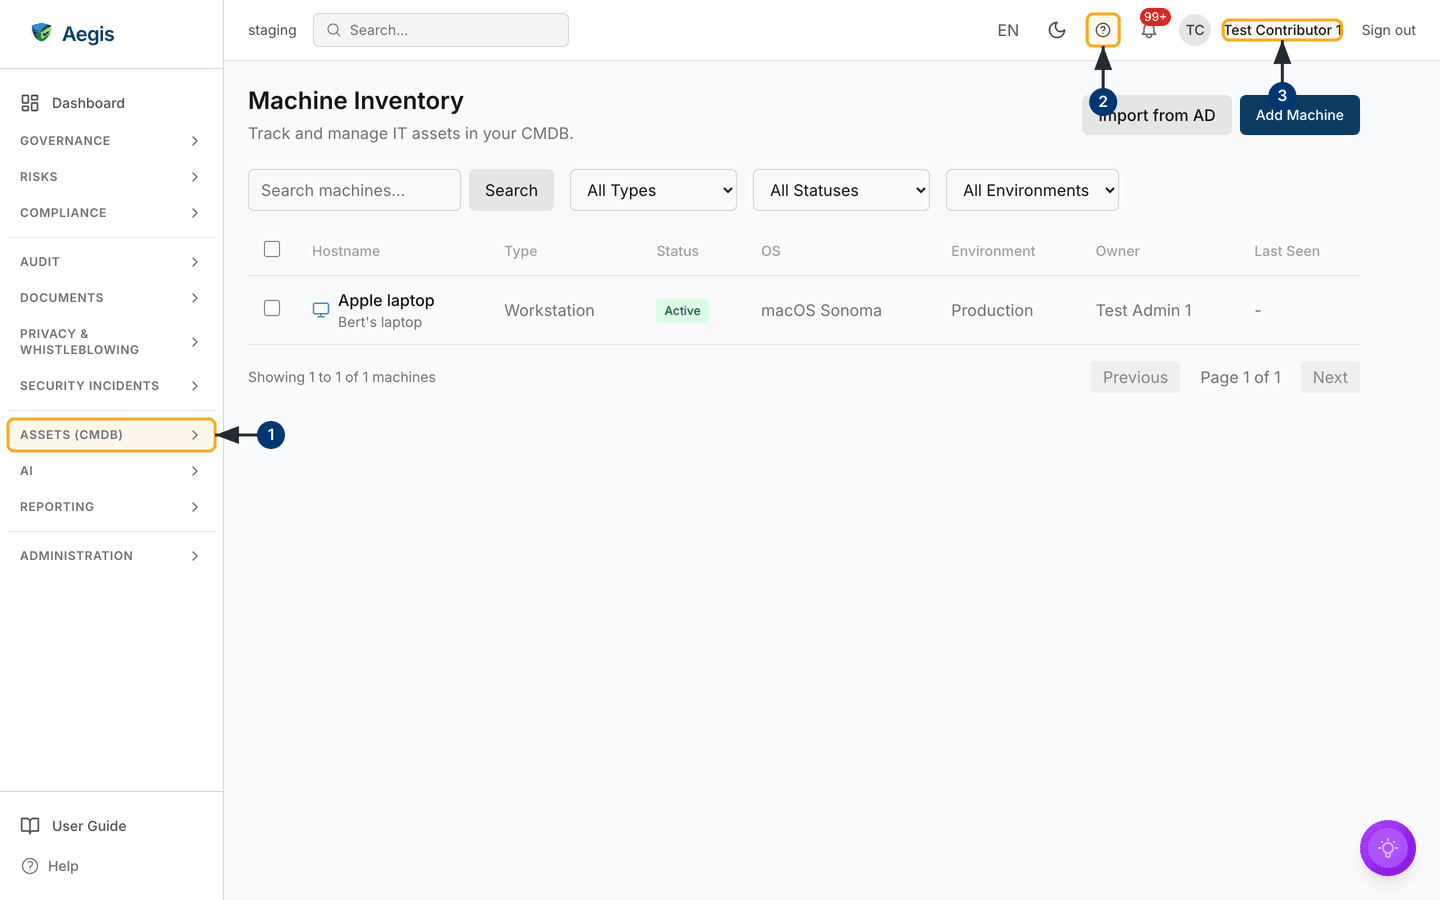
Opening /cmdb sends you straight to the machine list at
/cmdb/machines, headed Machine Inventory with the
subtitle “Track and manage IT assets in your CMDB.” The header's right carries
the action buttons — in the Contributor view below, the grey
Import from AD and the dark blue Add Machine. An
Export button joins them, to their left, for roles holding the
report-export right.
Under the header sits the filter bar: a Search machines… box with
its own Search button, then the All Types,
All Statuses and All Environments dropdowns. Search
filters as you type. The environment dropdown is built from the environments
already recorded on your machines, so it is absent while none carry one.
The table opens with a select checkbox, then Hostname,
Type, Status, OS,
Environment, Owner and Last Seen. Each
hostname cell carries a type icon and, underneath, the display name; a coloured
badge marks the status. Below it, “Showing 1 to 1 of 1 machines” sits opposite
Previous, the page count and Next — the list pages
twenty rows at a time. Selecting a row opens a detail panel from the right;
ticking checkboxes reveals a bulk-actions toolbar above the table.
The tenant captured here holds one machine, the workstation
Apple laptop, running macOS Sonoma in Production, with an empty
Last Seen cell. A tenant with no machines shows “No machines
registered. Add your first machine to get started.” instead of the table; a
filter that hides everything gives “No machines match your search criteria.”
Open the machine inventory
-
In the left sidebar, open the
ASSETS (CMDB)group — belowSECURITY INCIDENTS— and selectCMDB. TheMachine Inventorylist opens, and the group stays expanded to show Software, Information Assets, CMDB Services, External Services and SBOM. - The circled “?” in the top bar opens contextual help for the screen you are on. The global search box, the language selector and the light/dark toggle sit beside it.
-
Your initials and name sit at the far right, with
Sign outbeside them. If the header carries noAdd Machinebutton, you are signed in as a Viewer and this screen is read-only for you.
Add a machine by hand
Use this for a single asset — a new server, or a machine your directory does not cover.
-
Select
Add Machine. A dialog headedAdd New Machineopens over the list. -
Enter the
Hostname. It is the only field that blocks the dialog; leave it empty and the form reports “Hostname is required”.Typeis also marked required, but arrives pre-set toWorkstation. -
Add the optional
FQDN(the full network name) and a friendlyDisplay Name, which appears under the hostname in the list. -
Choose the
Type— Workstation, Laptop, Server, Virtual Machine, Container, Network Device, Mobile, IoT Device or Other. It sets the icon beside the hostname. -
Pick the
Operating Systemfrom the list (Windows, Windows Server, Ubuntu, RHEL and macOS builds), or choose “Custom (enter manually)”, which reveals a text box. Add anOS Versionif you know it. -
Set the
Environment— Production, Development, Test, Staging, QA or Custom — then fill inLocation,Department, anyIP AddressesandMAC Addresses(one per line or comma-separated), comma-separatedTagsand free-textNotes. -
Select
Add Machineat the foot of the dialog. It closes and the machine appears in the list with the statusActive.
Import machines from Active Directory
Where your operator has set up a directory connection that syncs computer objects, a Manager or an Admin can pull those machines in. This reads the accounts that connection has already synced into Aegis; it is not a spreadsheet upload.
-
Select
Import from AD. A dialog headedImport from Active Directoryopens on the connection step. -
Choose one of the connections listed — only those switched on and set to
sync computers appear, each showing its directory base (or Entra tenant) and
the date it last synced. Where there are none, the dialog reads “No AD
connections available” and offers a
Configure AD Syncbutton. -
Select
Preview Import. Aegis reportsTotal Found,New MachinesandWill Update, then lists the first ten objects, each taggedNeworUpdate. Nothing is written yet —Backreturns you to the connection list. -
Select the import button, which names the count — for example
Import 24 Machines. A progress step runs and the dialog stays open until it finishes. -
The dialog then shows “Import Complete!” with counts for
Created,UpdatedandSkipped, plus a warnings line where an object failed. SelectDone; the list refreshes and each imported machine carries a “Synced from Active Directory” banner on its overview.
The import matches on the directory object, so re-running it updates the
machines it created before rather than duplicating them. It writes hostname,
FQDN, display name, type, status, operating system and version, department and
Last Seen, overwriting your edits to those fields each run.
Environment, location, notes, tags, owner and addresses are left alone — record
local knowledge there. A preview reads up to 1,000 objects per connection.
Directory connections are set up in
Connectors, which is also where the
View source link on an imported machine takes you, and where
the dialog's own Configure AD Sync button now takes you — so
add or amend a connection there and switch on computer syncing.
Read a machine's full record
Selecting a row opens a panel from the right. Its header carries the hostname, with the machine type and its first IP address beneath, and a status badge to their right. Five tabs run across the top.
-
Select any row. The panel opens on
Overview: notes, owner, environment, location, department, the created and last-updated dates, and any tags. Type and status are read from the panel header rather than repeated here. An imported machine carries a “Synced from Active Directory” banner above the notes, with its last-sync date. -
Open
Technical. It holds four blocks:Network(IP address, MAC address, FQDN),Hardware(manufacturer, model, serial number, asset tag),Operating SystemandSystem(CPU cores, RAM, storage, last seen). -
Open
Risksfor the risks linked to this machine — title, status, severity and the date raised. Selecting one opens the full record in the Risk register. With nothing linked it reads “No risks linked to this machine”. -
Open
Incidentsfor the same against Incidents, each row showing severity and detection date. Then openHistoryfor the change log — what changed, when and who changed it, or “No audit history available”.
Nothing in Aegis currently writes manufacturer, model, serial number, asset
tag, CPU cores, RAM or storage — no form field and no import fills them.
Those two blocks are scaffolding and show a dash for every machine. The
network details, the operating system and
Last Seen are real.
Edit a machine, or retire it
-
Open a machine and select the pencil control in the panel header, beside the
status badge. Five fields become editable:
Notes,Type,Status,EnvironmentandLocation. The pencil is hidden from roles that cannot update machines. -
Update the
Notes, or correct theTypeif the machine was synced as the wrong one.EnvironmentandLocationare free-text boxes here rather than dropdowns, so keep your wording consistent — the environment filter is built from whatever has been typed. -
To retire the asset, set
StatustoDecommissioned. The other choices areActive,InactiveandMaintenance. Nothing is deleted; the record stays and stays searchable. -
Select
Save Changes. The panel returns to read-only, the row's badge updates in the list behind it, and the change is written to theHistorytab.Canceldiscards the edit.
Owner, department and hostname are shown but are not editable here. To change
status across several machines at once, tick their checkboxes and use
Change Status in the bulk-actions toolbar — that dialog adds
Unknown to the four statuses above. The same toolbar offers
Export (a direct CSV download of the selected rows) to roles with
the report-export right, and Delete, behind a confirmation, to
Managers and Admins.
Export the inventory
- Set your filters first — the export applies the search text and the type, status and environment filters currently on the list, as the dialog notes.
-
Select
Exportin the header. A dialog headedExport Machine Assetsopens on the format choice:CSV,JSON,XMLorExcel. -
Under
Fields to Export, tick the columns you want; a counter reads how many fields are selected.Select All,Select DefaultandClearset them in one action. Choosing none blocks the export. -
Tick
Include linked risks and incidentsto add count columns, then select the export button, which names the format. The file downloads.
Tips and limits
- Aegis does not scan your network to discover machines. The register is built by hand or fed from Active Directory; network discovery is not in this release.
- Risks and incidents are linked to a machine from those modules, not here. Both tabs are read-only views of links made elsewhere.
-
Last Seenis the last logon Aegis read from the directory. Machines added by hand show a dash until an import fills it in. -
There is no framework-scope field on a machine. To mark assets as in scope
for an audit, use
Tagswith the search box, or track scope in Audits.
Where this connects
A maintained inventory underpins your audit readiness and gives Anomalies context for what normal looks like. Software on these machines is covered in Software and SBOM; the data they hold in Information Assets; the services they support in CMDB Services and External Services. The suppliers behind them stay in Vendors, a separate register. Directory connections live in Connectors, every change here also appears in the Audit log, and the rights behind each button are listed in What each role can do.