Scenario: responding to a security incident
A suspicious login is spotted at nine in the morning, and the next seventy-two hours decide whether you meet your reporting deadlines — this chapter walks the screens in the order you will actually open them.
An incident (a security event that has
already happened, as opposed to a risk, which is something that might) is
logged, worked and closed in the Incidents module.
A real response, though, crosses several surfaces: the register at
/incidents, the quick-view panel that a row click opens over it,
the full incident detail page at /incidents/{id}, the NIS2
significance wizard that opens from that page, and — for managers — the
cross-incident dashboard at /incidents/reporting. The register's
eye icon and its row click go to different places, and it matters: the two
surfaces do not carry the same controls. We follow one event from detection to
closure with two people in it: Marcus, a
Contributor, who spots the
unauthorised access and works the case, and Lena, a
Manager, who rules on whether it
is a NIS2-significant incident. NIS2 is a European cybersecurity law with staged
mandatory reporting; GDPR is the EU data-protection law, with its own 72-hour
breach-notification window.
Aegis works out which deadlines apply, counts them down from the detection
time, assembles a draft you can read, and records when you mark a filing as
done. Sending the report to the authority — and deciding whether to report
at all — stays with a named person in your organisation. The
Regulatory Notifications panel says exactly that on screen:
drafts are generated for review only, and the field mappings need sign-off
from your data protection officer or legal team.
Who does what in this scenario
Reading the register is open to every role, including
Viewer — and so is the
Export bulk action, which is gated on read permission rather than
on write. Logging an incident, moving its status, adding timeline entries and
recording notifications need
Contributor or higher. The
reporting dashboard and the overdue banner that crosses the top of every page
are limited to Manager and
Admin; a Contributor who opens
/incidents/reporting is sent back to the register. The full matrix
is in What each role can do.
What's on this screen
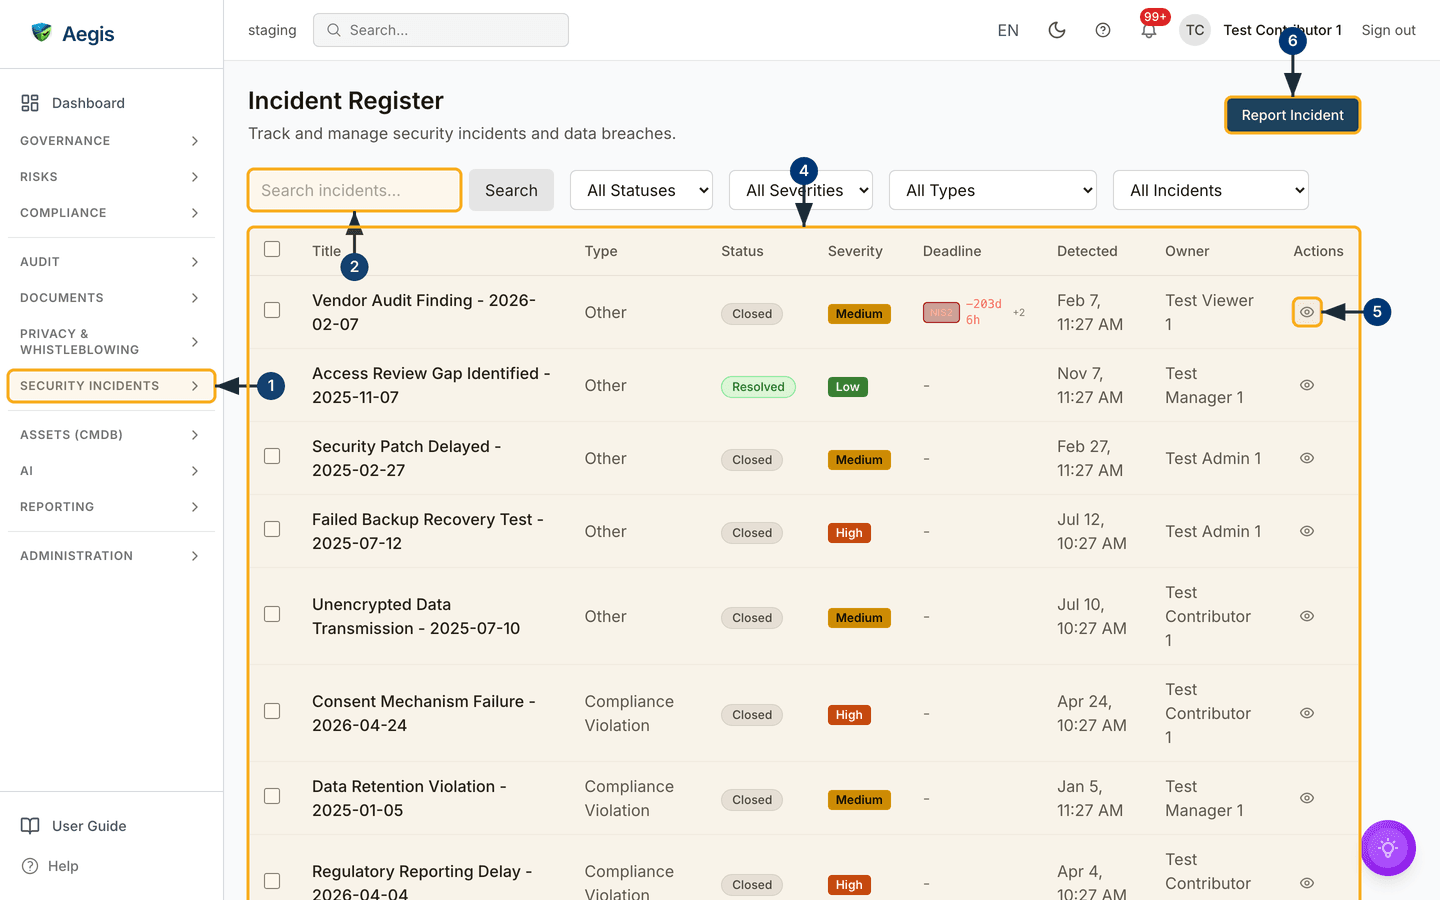
The journey starts on the Incident Register, reached from the
Security Incidents group in the left menu. The heading sits over
the line "Track and manage security incidents and data breaches", and the
primary action — the dark blue Report Incident button — is at the
far top right.
One filter row runs beneath it: a Search incidents... box with its
own Search button, then three dropdowns reading
All Statuses, All Severities and
All Types, and a fourth reading All Incidents that
isolates data breaches (Data Breaches Only or
Non-Data Breaches). The filters combine with AND.
The table begins with a selection checkbox column — that is what feeds
Export — then runs Title, Type,
Status, Severity, Deadline,
Detected, Owner and Actions.
Status and severity are coloured chips. Deadline is the cell to
watch: it shows a framework chip and a countdown to the next outstanding stage,
turning red with a negative figure once the window has passed, plus a small
+2 marker — hover it for "+2 more deadline(s)" — when further
stages are still awaiting a filing. In the capture below, taken as a Contributor
against a seeded environment, only the top row carries a deadline: a red
NIS2 chip reading -199d 7h with that
+2 beside it. Every other row shows a dash, because nothing on
those incidents is still outstanding. A dash is about deadlines, not about
status — the top row is itself Closed.
Actions holds an eye icon (View details) that
opens the full detail page; a delete icon appears there for
Admin and
Manager, and is absent from this
Contributor capture. Clicking anywhere else on the row opens the quick-view
panel instead — the surface that carries Add Entry and the close
summary.
Step 1 — Find the register, and look before you log
Marcus's first move is not to create anything. Two records for one event split the timeline in half and make the countdowns ambiguous, so he checks whether a colleague has already reported it.
-
Open
Security Incidentsin the left menu and chooseIncidents. TheIncident Registerloads with the most recently created records at the top. The order follows when each record was logged, not when the event was detected, so theDetectedcolumn will not read as a straight sequence down the page. -
Type a distinguishing word into
Search incidents...— a hostname, a system name — and selectSearch. The table reloads with only matching titles; the search runs against the title, not the description. -
If that is still too broad, narrow it with the
All StatusesandAll Typesdropdowns. The table refreshes as each filter is applied. Filters are not written back to the address bar, so a link you copy will not carry them; a?search=link is the exception, because the search box is seeded from it on load. -
Read any matching row across. The
StatusandSeveritychips show how far the response has got, andDeadlineshows whether a reporting window is already running. -
If the event is on record, select the eye icon under
Actions. The detail page opens at/incidents/{id}with the full timeline — join that response rather than starting a second one. -
If nothing matches, select
Report Incident. TheReport New Incidentform opens over the register.
Step 2 — Get the event on record
The form is deliberately short. During a live response you want the record open within minutes; the rest goes onto the timeline as you learn it.
-
Enter an
Incident Titlea colleague would recognise. With the detection time further down, it is one of only two entries the form will reject you for leaving empty.Incident TypeandSeverityare marked required too, but they arrive pre-set toOtherandMedium, so change them on purpose rather than by omission. -
Use
Descriptionfor what you know so far — what happened, and how it came to light. It can stay thin at this stage. -
Choose the
Incident Type; Marcus picksUnauthorized Access. Type matters later:Data Breach,System CompromiseandUnauthorized Accesscount as high-risk types in the NIS2 checks. -
Set
SeveritytoHigh. Each option carries a one-line description, and severity can be revised as the picture changes. -
Fill in
When was the incident detected?with the moment the event was first observed. The help text under the field states plainly that this timestamp drives the GDPR 72-hour calculation. A time in the future is rejected. -
List machines and services in
Affected Systems, separated by commas. They appear as tag chips on the detail page, and "at least one affected system" is one of the four automatic NIS2 checks. -
Tick
This incident involves a personal data breachif personal data may have been accessed, disclosed or lost. ANumber of Data Subjects Affectedfield appears beneath it for an estimate. -
Select
Report Incident. The form closes, the register refreshes, and the incident is listed inOpenstatus with your name as owner.
Every NIS2 stage and the GDPR window are counted from Detected,
not from when the record was created. An incident logged two days late must
still carry its true detection time, or the countdowns will be wrong in your
favour — the worst direction for them to be wrong in.
Step 3 — Open the investigation and keep a running account
-
On the detail page, find the status actions at the top right. Only
transitions that are valid from the current status are offered, so from
Openthe buttons readMark investigating,Mark containedandMark closed. Marcus selectsMark investigating: the status chip changes and the transition is stamped onto the timeline with his name and the time. -
To add an account of your own, go back to the register and click the row
itself rather than the eye icon. That opens a quick-view panel whose
Timelinesection carries anAdd Entrybutton: write what you have found in the entry box and confirm. The note appears at once, attributed and timestamped — this is the account an auditor will read, and it cannot be reconstructed honestly afterwards. TheActivity Timelineon the full detail page lists the same entries but is read-only, so the quick-view panel is the only place the interface lets you write one. -
Use
Communicationsto tell colleagues. Internal messages go out directly; anything aimed at customers, regulators or the public runsCreate draft→Approve→Send, so no external statement leaves on one person's say-so.
Step 4 — Decide whether it is a NIS2 significant incident
This is Lena's call, and it is what starts the regulatory clocks. The wizard
opens from the
AI Analysis panel in the right-hand column of the detail page —
Assess Significance while no assessment exists,
Open Full Assessment once one has run — and the
NIS2 Significance Assessment it opens walks the call in three
steps.
- Automatic checks. Four indicators are evaluated from the incident's own data and marked met or not met: high or critical severity, the data-breach flag, at least one affected system, and a high-risk incident type. A summary line reports how many of the four are positive.
-
AI assessment. Select
Run AI Assessmentfor a second reading, or skip straight to the decision. The assessment returnsLikely SignificantorNot Significantwith a confidence percentage and reasoning against the two NIS2 criteria. -
Decision. Lena chooses
Mark as Significant— its hint reads "Activates NIS2 reporting deadlines" — writes a justification, checks the deadline preview, and confirms. The alternative,Not Significant, records the decision and the reasoning without starting a clock.
Step 5 — Work the deadlines
From that moment the detail page carries a NIS2 alert listing the stages: an early warning at 24 hours, an incident notification at 72 hours, an intermediate report that has no fixed date because it is sent only when the authority asks for it, and a final report one month after the 72-hour notification deadline. Because the data-breach box was ticked, a GDPR alert runs alongside it, quoting Article 33 with the time remaining in the 72-hour window.
-
Find
Regulatory Notificationsfurther down the detail page — the section appears once the incident is flagged as a data breach or marked significant — and selectGenerate draftagainst the stage that is due. Aegis assembles the fields it holds into a draft you can read on screen and copy. As shipped, the built-in templates target the Belgian regulators —GBAfor the personal data breach notification under GDPR Article 33, andCCBfor the NIS2 Article 23 staged report. - File the notification through the authority's own channel. Aegis transmits nothing.
-
Come back and select
Mark as filed. You are prompted for the reference the authority gave you; enter it and the stage flips toFiledwith that reference shown beside it. -
For GDPR there is also a direct control:
Record GDPR Notification, which sits with the status actions while the breach is unnotified and stamps the notification time. Use it even when the notification went out entirely outside Aegis — the point is the audit trail. -
Lena watches the whole portfolio from the
Incident Reporting Dashboard. Counters across the top showOverdue,Due within 24h,On TrackandTotal Active; a filter switches between all frameworks, NIS2 and GDPR; and theActive Deadlinestable runsIncident,Framework,Stage,Deadline— a countdown — andStatus, each row ending in aViewlink into the case. A completed-notifications section below records which filings went in on time and which were late. -
If a stage goes overdue or falls inside 24 hours, a coloured banner appears
at the top of every page for Managers and Admins, naming the framework, the
stage and the incident, with
ViewandDashboardlinks.Dismiss bannerhides it for half an hour; it does not clear the obligation.
Step 6 — Contain, resolve, close
-
Once the threat has been stopped from spreading, select
Mark contained. The containment timestamp is written into theTimelinepanel of key dates in the right-hand column, besideDetected,Reported,ResolvedandClosed. -
When the root cause has been dealt with and normal service is back, select
Mark resolved. -
Select
Mark closed. From the detail page this applies at once: the status moves toClosed, the closure timestamp is set, and there is nothing further to fill in. -
To record a resolution summary as you close, use the quick-view panel from
the register instead.
Mark closedthere opens aClose Incidentconfirmation with one field,Resolution Summary (Optional); confirm, and whatever you wrote is saved to the incident's lessons learned. Either wayClosedis terminal, so anything discovered later goes on the timeline as a new entry rather than reopening the case.
Closing from the full detail page does not ask for a summary at all, and the quick-view panel's close step asks but does not require one; what you write there is stored as lessons learned. Root cause and remediation are separate sections that appear on the detail page only once they hold content, and as shipped there is no on-screen field for filling them in — the close summary is the post-incident text Aegis actually captures through the interface. Treat it as required by your own policy, even though the software will let it through empty.
The AI assist
Two AI features touch this journey, and neither of them decides anything. The
AI Analysis panel offers Assess Significance,
returning a Likely Significant or
Not Significant verdict with a confidence figure, per-criterion
reasoning, the frameworks it believes apply and recommended actions; it can also
draft the text of a reporting stage and show how much of the required NIS2 field
set is covered. A deeper triage pass runs a broader read across NIS2, GDPR and
DORA significance, whether personal data is involved, which stages apply, and
related risks, assets and controls. Its own on-screen note is the honest
summary: it reads internal records only, takes roughly thirty to ninety seconds,
and its conclusions must be confirmed by a person. The clocks start when Lena
confirms the decision in the wizard, never when the AI returns a verdict. If
AI_ASSIST is switched off for your licence, the four automatic
checks and the decision step still work exactly as described above.
What to take away
- Search the register before logging — one event, one record, one timeline.
-
Get
Detectedright; every countdown is measured from that moment. - Write the timeline as you go, not afterwards.
- Filing stays manual. Aegis drafts, counts down and records; a named person decides, submits, and enters the reference.
-
A dash in
Deadlinemeans nothing is outstanding — it does not mean closed. - Timeline notes and the close summary are written in the quick-view panel opened by clicking a register row, not on the full detail page.
Where this connects
The complete module reference is in Incidents, and the manager view in Incident reporting. To have incidents opened from connector alerts instead of by hand, see Auto-incident rules and Connectors; to trigger follow-up tasks automatically, see Workflows and Action items. The data-breach side continues in GDPR, and financial-sector reporting has its own rules in DORA. Affected machines and services come from the CMDB, and a recurring cause belongs in Risks. Every status change, notification and timeline entry here is written to the Audit log. For who may assess significance and reach the reporting dashboard, see What each role can do.