Control monitoring
Keep a running health reading on every control in your frameworks, so a control that is weakening shows up here before an auditor or an incident finds it.
A control is a safeguard against a risk — requiring multi-factor authentication, for example. A control you never check is only a statement of intent. This page keeps a monitor (a scheduled automatic check) against each control in the compliance frameworks you have enabled, and shows a health status for each. A background job re-checks the monitors that fall due every thirty minutes; alongside it you record your own test results by hand, which build a dated history.
Control monitoring sits in every licence tier's default feature set; where a licence does not carry it, the page reads “Control monitoring is not available on your current plan.” instead of the table. The module has to be provisioned for your tenant as well — without that the page still opens, but the list cannot load.
Who uses it
Reading is open to every role. Changing anything needs ccm:update,
held only by Manager and Admin. Buttons you cannot use are hidden rather than
refused — the one exception is the initialise action below.
-
Viewer and
Contributor filter the
list, open any monitor and run the AI triage. Neither sees
Record Test ResultorDisable Monitor. - Manager also records test results, switches a monitor off and back on, and runs the initialisation.
-
Admin does all of that, and
alone reaches
/settings/control-monitoringto add, edit or delete monitors.
What's on this screen
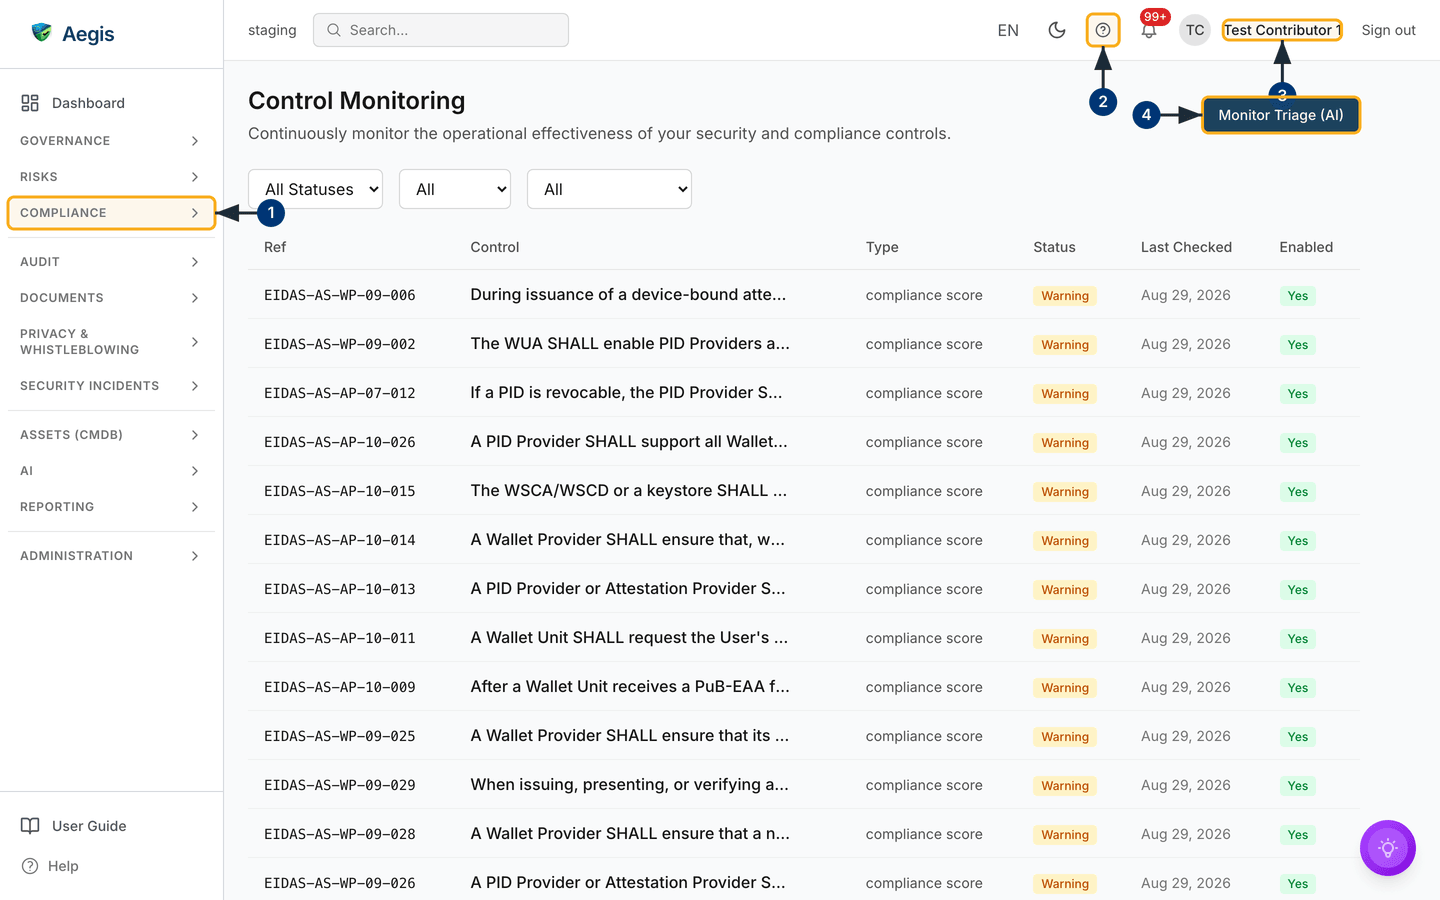
The page opens on the /control-monitoring list. On the left, the
sidebar groups every module — Governance, Risks, Compliance, Audit and the rest
— with control monitoring inside Compliance, collapsed until
you open it. Along the top run the environment label, global search, the
language and dark-mode switches, the Help “?”, your notifications, your name and
Sign out.
The header reads Control Monitoring over its one-line description,
with a single action — Monitor Triage (AI) — at the far right.
Below it sit three filter dropdowns, each showing only its current value and no
label: All Statuses, then All twice. Left to right
they are Status, Enabled and
Review; go by position. Then the table, twenty rows to a page:
Ref, Control (truncated to fit),
Type, Status,
Last Checked and Enabled. There are no per-row
buttons and no tick-boxes — selecting a row opens that monitor over the list.
Below the table sit your saved AI briefings and the action items raised from
them. In the capture an eIDAS framework has been loaded but not assessed, so
every row reads amber Warning.
-
In the sidebar, open the Compliance group and select
Control Monitoring. The group expands and the list loads, with the entry highlighted while you are on the page. - The Help “?” opens this guide at the chapter matching the page you are on.
- Your name at the top right shows the account you are signed in as. Your role decides whether the write buttons appear inside a monitor — this capture is a Contributor, so they do not.
-
Monitor Triage (AI)sits at the right of the header. Selecting it opens the triage panel described below; it reads your monitors and changes nothing.
Setting up the monitors the first time
-
Open
/control-monitoring. With no monitors yet, the table is replaced byNo monitors configuredand anInitialize Monitorsbutton. -
Select
Initialize Monitors. Aegis creates a compliance-score monitor for every control of an enabled framework that lacks one, refreshes the table, and confirms with “Control monitors initialized.” Running it again only fills gaps; one run covers up to 1,000 controls. -
The new rows read grey
UnknownwithNeverunder Last Checked until the job reaches them — once a day for these monitors.
This action is not hidden from a Viewer or Contributor, but the request
behind it needs
ccm:update and is refused. If you see “Could not initialize
control monitors.”, ask a Manager or Admin.
Narrowing the list
-
Open the first dropdown, Status, and pick one of the five
statuses. The table reloads showing only that status;
All Statusesrestores the rest. - Open the second, Enabled, to separate the monitors you are watching from those switched off.
-
Open the third, Review, and choose
Overdue review— its only option besidesAll. Only monitors past their next review date stay on screen. The filters combine.
Opening a monitor
-
Select any row. The detail opens over the list, titled
Monitor: <reference>, status badge at the top. For a Manager or Admin,Disable MonitorandRecord Test Resultsit beside it. - Framework Control gives the control's reference and title; Monitor Configuration the type, the check interval, the last and next check, and whether the monitor is enabled.
- Three sections appear only when there is something to show: Thresholds where the monitor carries its own warning and critical day counts, Recent Alerts once alerts have been raised, and Last Check Details once a check has run — the readings behind the status, as labelled rows.
-
Review Cycle gives the interval in days, the last tested
date and the next review, with a red
Overdue Reviewbadge once that date has passed. Linked Risks names the risks this control mitigates with their status, read-only here; Test Results holds the dated history, newest first; and Metadata closes the panel with the created and last-updated dates.
Recording a test result
A test result is your own check of a control, written down. It needs Manager or Admin.
-
Open the monitor and select
Record Test Result. A small form opens with two fields. -
Choose the Result:
Pass,FailorPartial. It opens onPass. - Write your Notes — what you tested and what you found. Optional, up to 5,000 characters, and what makes the entry useful to an auditor later.
-
Select
Save Test Result. “Test result recorded” confirms it and the entry appears at the top of Test Results with its badge and timestamp. The review cycle is recalculated from it; the status badge is not.
It stamps the result as you save, takes no attachments and has no evidence picker. File your proof under Evidence and name it in your notes.
Switching a monitor off and back on
-
Open the monitor and select
Disable Monitor. It stops being checked and stops raising alerts, the list showsNounder Enabled, and its history survives. -
To resume, select
Enable Monitor. Checking restarts at the next scheduled run rather than immediately.
How a status is decided
Each monitor has a type, and the job reads the source that
matches it: the control's own status and maturity (compliance score), the age of the linked evidence (evidence freshness), or whether
linked policies, risk assessments or vendor assessments are overdue. Readings
are counted in days against two thresholds, 30 and 7 by default: a due date 30
days out reads Warning and 7 days out Critical, while
evidence reads Warning past 30 days old and
Critical past 37. A control with no evidence linked reads
Warning. When a check changes a monitor's status to anything other
than Healthy, an alert is recorded and every Admin and Manager is
notified.
| Status | What it means |
|---|---|
Healthy |
The last check found the control inside its thresholds. |
Warning |
Degrading — stale evidence, a review falling due, a control not yet started. |
Critical |
The control is non-compliant, or past its critical threshold. |
Unknown |
Never checked. Expect this straight after initialisation. |
Disabled |
Switched off by a person. Not checked, raises no alerts. |
That is why the capture reads amber throughout: each of those controls is still
Not Started. Read the column as a measure of how much assessed data
stands behind each control, not a verdict on your organisation.
The AI assist
Monitor Triage (AI) answers one question: of everything that is not
healthy, what should you deal with first? Aegis ranks the monitors needing
attention — Critical, Warning and
Unknown — by status, control importance, unresolved alerts and
overdue checks. That ranking is Aegis's own and reproducible; the AI narrates it
with a next step per entry, and cannot reorder it or invent monitors.
-
Select
Monitor Triage (AI). A panel opens headedAI Control-Monitoring Triage, explaining what triage covers and noting that it changes nothing. -
Select
Run Monitor Triage. The progress line moves through scanning, ranking and drafting, and the plan streams in as it is written. -
Decide what to do with the result:
Copy,Export DOCX,Export PDF,Save as recordto keep it below the table, orRun again. - The panel also offers the at-risk monitors as a tick-list of ready-made action items, each titled with its real control reference. They arrive already ticked, so clear the ones you do not want before creating them; the rest appear on the Action items workbench.
Triage covers the fifteen highest-ranked monitors, so on a large tenant read it as the top of the queue rather than the queue. Each run carries a confidence indicator and the records it drew on. It is a reading list, not a decision — a person reviews it and acts — and each run costs one AI action against your allowance.
Tips and limits
- Recording a test result does not move the status badge. The two are deliberately separate: the badge is what the check read from your data, the result is what a person confirmed by hand.
-
The list has no create form, no search box, no CSV export and no bulk
selection. An Admin adds, edits or deletes individual monitors at
/settings/control-monitoring, choosing from five types —Evidence Freshness,Policy Review Due,Risk Assessment Due,Compliance Score ThresholdandVendor Review Due. For a new control, add it to its framework first, then initialise again. - Disabling is reversible; deleting a monitor is not. A status can lag the data by up to the monitor's check interval — a day for the monitors the initialise action creates — because there is no “check now” button here.
Where this connects
The controls monitored here come from your Compliance frameworks; their proof lives in Evidence. The readings feed Audit readiness; a failing control is a live input to Risks, mapped in Control mapping. Triage work lands in Action items; roles are in Roles overview.