Anomaly Detection
Aegis watches its own activity record for unusual behaviour — off-hours bursts, volume spikes, bulk exports — and lists each flagged pattern for a person to judge.
Most of Aegis records settled facts: an approved policy, an accepted risk, a control that passed its last test. This screen is different. An anomaly (a flagged deviation worth a human look) is raised when activity stands out from the normal pattern — hundreds of actions outside typical working hours, an hourly count far above the usual baseline, a run of exports from someone who rarely exports.
The signals come from Aegis's own audit trail — actions taken inside the platform — not from firewalls, sign-in providers or a threat feed. Aegis is not a SIEM (a security information and event management system) and does not replace your security tooling. Its job is narrower: frameworks such as ISO 27001 and NIS2 (a European cybersecurity law) expect evidence that unusual activity is reviewed, not only logged.
Who uses it
Anomaly Detection is a licensed feature, carried by the Professional and
Enterprise licences. Where it is not enabled, a centred notice under an amber
icon replaces the list:
Anomaly detection is not available on your current plan, with an
invitation to upgrade. Reading it is open to every role,
Viewer and
Contributor included; changing
a review status or dismissing an anomaly is drawn only for
Manager and
Admin. The screenshot below was
captured as a Contributor — hence the plain Review Status badges
and no Dismiss
link.
What's on this screen
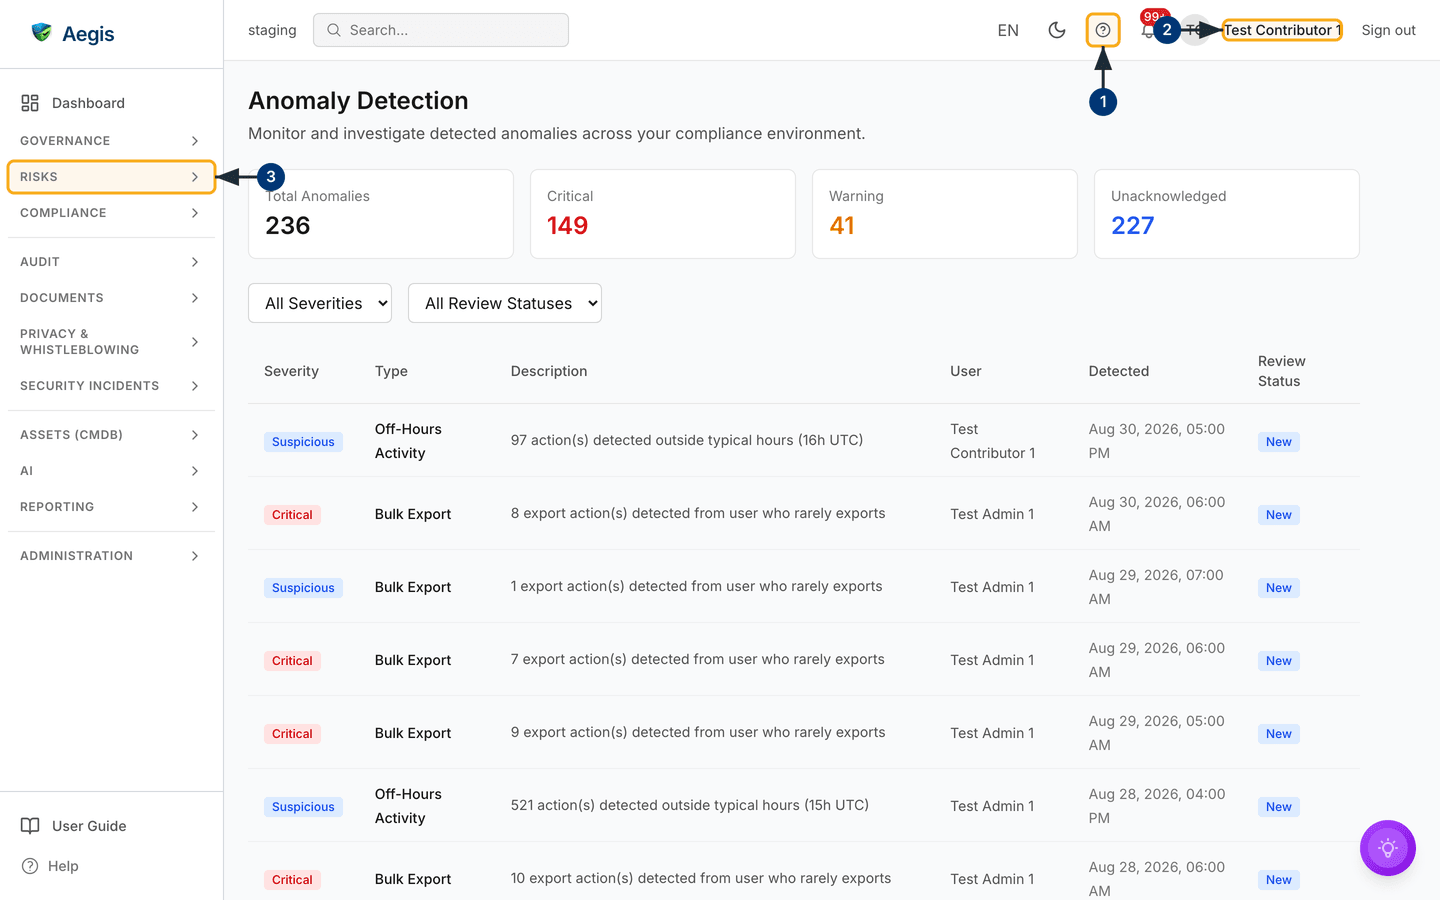
The header reads Anomaly Detection, with "Monitor and investigate
detected anomalies across your compliance environment." underneath. There is no
create button — anomalies are detected for you, never entered by hand — and no
export. Below it sit four cards: Total Anomalies,
Critical in red, Warning in amber and
Unacknowledged in blue, reading 220, 137, 41 and 216 in the
captured tenant — a seeded demonstration set, so treat the numbers as
illustration. If they fail to load, a red notice replaces the cards with a
Retry button; the table still works.
Under the cards is a thin filter bar with two dropdowns — severity (All Severities) and review status (All Review Statuses). They are the only way
to narrow the list; there is no search box or date picker.
The rest is the table: Severity (a coloured badge),
Type, Description (a line such as "Action volume of
883 actions/hour exceeds baseline of 128.11 (z-score: 3.46)", where a
z-score measures how far activity sits from
the baseline), User (or System),
Detected and Review Status. Rows run twenty to a page;
a Manager or Admin sees one more, unnamed column carrying the
Dismiss link.
-
Select the
?help button in the top bar. It opens this guide in the app at the chapter for the screen you are on. - Check the name at the top right — the account you are signed in as decides the rest. A Manager or Admin gets the write controls; everyone else reads the same list without them.
-
Open the
Risksgroup in the left menu and selectAnomalies./anomaliesloads with its cards, filters and table — it sits with the risk register because Aegis treats detection as a risk signal, not a security console.
Read and triage the list
-
Read
Criticalfor how many flags sit furthest from the baseline, andUnacknowledgedfor how much of the total nobody has judged. -
Scan the table from the top — newest first.
Descriptionstates what was found, including the counts and baselines behind it. -
Check
UserandDetectedto place the activity. A late-night burst from an account that normally works office hours deserves more attention than the same pattern from a known overnight job. -
Open the severity dropdown and choose
Critical. The table reloads with only critical flags; work down throughWarningandSuspiciousafter. -
Open the review-status dropdown and choose
Newfor the untouched queue, or any other value to see what is in progress or decided.
Open an anomaly to see what triggered it
-
Select anywhere on a row. A dialog titled
Anomaly Detailsopens, showingType,Severity,Review StatusandDetectedin a four-field grid. -
Read
Descriptionbelow the grid — the full detection line, without the two-line truncation the table applies. -
Read
Related Events: the audit-log entries that triggered this anomaly, each with its action and timestamp. Where an anomaly carries none — older rows detected before this link existed — the section says so rather than showing an empty list. -
Select
View in audit logbeside an event to open that entry in the Audit log.
Work an anomaly through its review status
Every anomaly carries a review status (where
it sits in your triage): New, Investigating,
Confirmed or False positive. This is the trail an
auditor reads.
-
Open the dropdown in the row's
Review Statuscell. It offers only the moves allowed from that row's current status, so an illegal step is never presented. -
Choose
Investigatingwhen you start looking into a flag. It saves at once, a confirmation appears, and the table and cards refresh. -
On a verdict, set
Confirmedif the activity is genuinely unusual, orFalse positiveif it was expected. Either marks the anomaly acknowledged, so theUnacknowledgedcard falls by one. -
To correct a wrong call, open the dropdown again:
Confirmedcan move back toInvestigatingor across toFalse positive, and the reverse. A refused move names its reason and leaves the row unchanged.
Marking an anomaly Confirmed records your verdict; it does not
open a case, assign an owner or start containment, and there is no "promote
to incident" button here. If a confirmed flag points to something serious,
raise it yourself as a full incident and
reference the anomaly there.
Dismiss an anomaly you have cleared
Each row not yet acknowledged also offers a Dismiss link at the
right end. It acknowledges the flag and sets it to
False positive in one step — the fast path for clearing noise, for
Managers and Admins only.
- Satisfy yourself the row is expected behaviour — read the description, user and time, opening the detail if you need the triggering events.
-
Select
Dismiss. The table refreshes, the link drops off the now-acknowledged row, and theUnacknowledgedcard falls by one. -
To review what has been cleared, set the review-status filter to
False positive; set it back toNewfor the live queue.
A dismissed or confirmed anomaly stays in the record under its review
status, so the history of what was flagged and how it was judged stays
complete. There is no delete control: a wrong call is corrected by moving
the review status, not by removing the row. Moving a decided anomaly back to
Investigating also clears its acknowledgement, so it returns to
the unacknowledged queue, the Unacknowledged card rises by one
and the Dismiss link comes back on that row.
The AI assist
The detail dialog carries one AI action, Explain (AI), at the
bottom right: a plain-language account of what happened, why it matters, and a
proportionate response.
-
Open an anomaly and select
Explain (AI). A dialog headedAI Anomaly Explanationopens, describing what it covers and noting that it is read-only. -
Select
Explain anomaly. The text streams in as Aegis loads the record, assesses the deviation and severity, and recommends a response; a confidence figure and the evidence used arrive at the end. -
Keep the briefing with
Save as recordif it is worth referring to later — saved explanations are listed under the anomaly.Run againproduces a fresh one.
Aegis reasons over that one anomaly's record — the recorded baseline and observed values, and the signals it computed itself — and nothing else. It reads no external data, invents no metrics or events, and changes nothing: the review status, the acknowledgement and any escalation stay a person's decision. Each run costs one AI credit.
What Aegis flags
Flags are produced in the background by comparing recent activity against a rolling baseline of normal behaviour. There is no rule builder or threshold editor in this release.
| Type | What it flags |
|---|---|
Volume Spike |
An hour's action count far above the usual rate, with baseline and z-score. |
Off-Hours Activity |
Actions taken well outside the typical working hours for the account. |
Bulk Export |
An unusual number of exports, especially from someone who rarely exports. |
Unusual Action |
An action type that is out of character for the account. |
Privilege Escalation |
A change that raises an account's access level. |
GEO_ANOMALY |
Actions from a client IP address the account has not been seen using
before. This one has no display label yet, so it appears in
Type as the raw value.
|
Severity comes from the z-score alone — how far the activity sits from the
baseline. Above four is Critical, above three Warning,
above two Suspicious; anything closer to the baseline than that is
not raised at all. Those three are every severity the detector assigns, and all
three are offered in the severity filter.
Tips and limits
- Triage is deliberately light — no assignee field, comment timeline, evidence attachment, bulk selection or CSV export.
-
Escalation is manual — nothing promotes an ageing or critical anomaly on its
own, so make the review a standing habit. A weekly pass over the
Newqueue works well. - Anomalies are retained so the review record stays complete. For a retention policy, ask your Aegis operator.
Where this connects
The Audit log is the raw trail these flags are computed from; this page is the unusual-behaviour view of it. When a flag turns out to be a real security event, open Incidents. A recurring pattern belongs in the risk register, and a well-kept CMDB helps you judge an anomaly in context. Credit balances live on the AI dashboard; role limits in Part 3.