Your dashboard
The dashboard is the page you land on after signing in, and the page you come back to whenever you want to know where your organisation stands right now.
The dashboard gathers the numbers that matter — your compliance score, active policies, open risks, vendors, policies waiting on a review — beside a per-framework progress list and a compliance trend chart. Each panel is a widget (a small self-contained card showing one number, chart or list). Two buttons at the top ask Aegis's AI to read the same data and say what to look at first. You can add, remove, move and resize widgets; the layout you build is saved to your own account and nobody else sees it.
Who uses it
Every signed-in user can open /dashboard: there is no role gate on
the page, and the module cannot be switched off. What you can do from a widget
still follows the module behind it. A
Viewer sees the
Open Risks count and can follow it into the register, but finds no
create button there. A
Contributor,
Manager and
Admin can act on what they find.
What needs my attention? and the ? on a KPI card need
the compliance-read permission; without it neither is rendered.
Ask AI is the button that hides when the AI assist feature is off
for your licence. The briefings are gated on that feature at the server, so
without AI assist the other two buttons still appear but return a refusal.
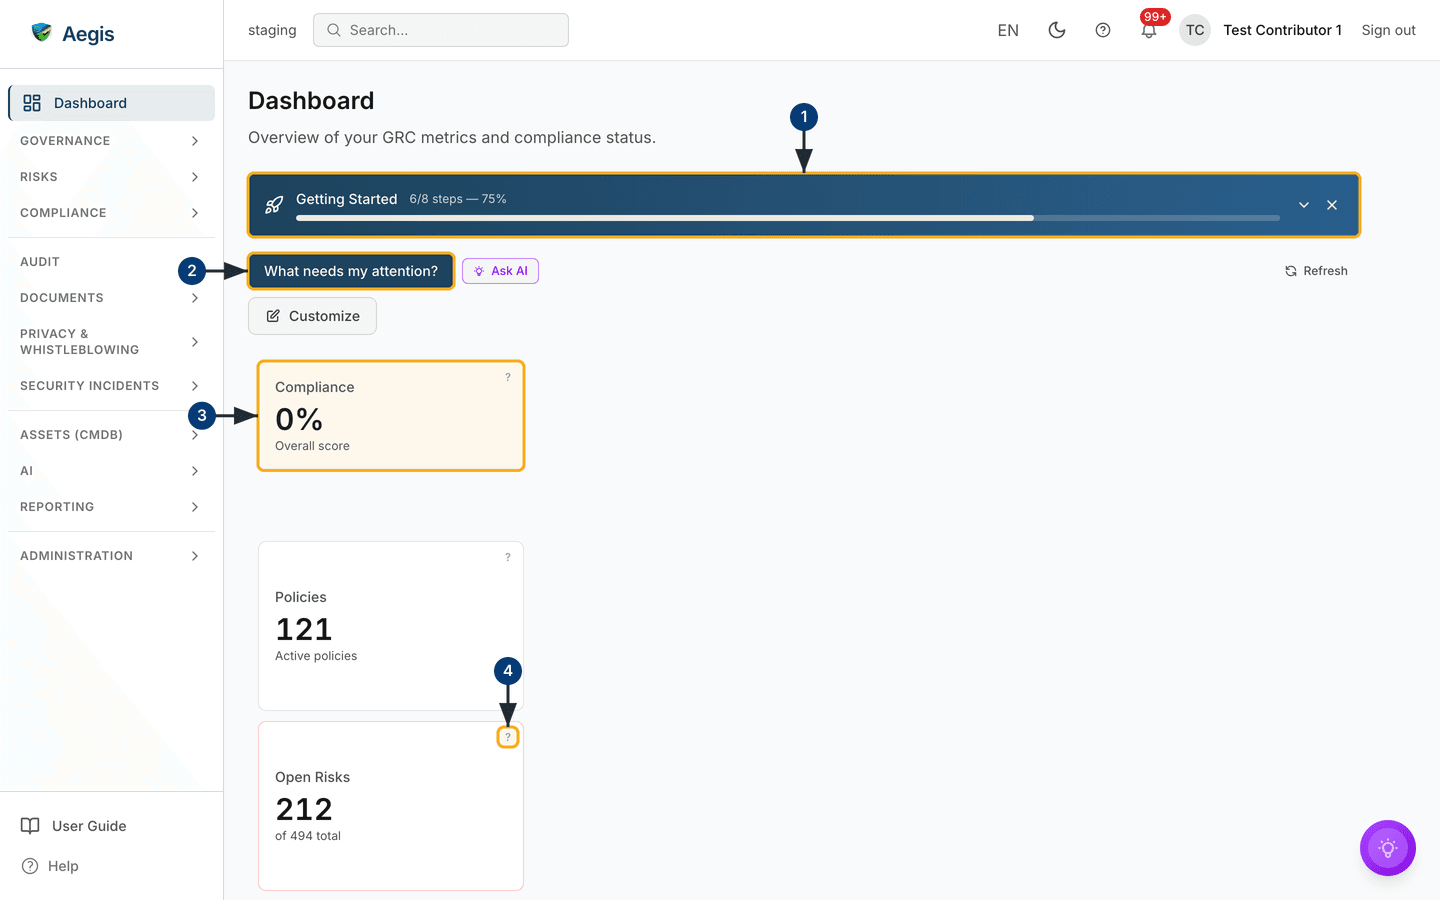
Customize is available to everyone. The screenshot below was
captured as a Contributor on a seeded staging workspace.
What's on this screen
The top bar runs across every page: the workspace name (staging in
the capture) and a search box on the left; on the right the language selector,
the light/dark toggle, a help icon, a notification bell with an unread count,
your name and Sign out. Down the left is the navigation sidebar,
with Dashboard pinned at the top and highlighted as the page you
are on, then collapsible groups from GOVERNANCE down to
ADMINISTRATION, and User Guide and
Help at the foot.
The page opens with the heading Dashboard and the line "Overview of
your GRC metrics and compliance status" (GRC — governance, risk and compliance).
A workspace that has not finished onboarding then shows a blue
Getting Started banner with a progress bar —
6/8 steps — 75% in the capture — a chevron that expands the
remaining steps and an × that dismisses it.
Below the banner is a toolbar row — What needs my attention? and
Ask AI on the left, Refresh on the right,
Customize beneath — and everything under that is the widget grid.
The default layout holds ten widgets: the cards Compliance,
Policies, Open Risks and Vendors, then
Pending Reviews, Vulnerability Intelligence and
Framework Progress, then Compliance Trend beside
Risk Heatmap, and Recent Activity last. Below the
grid, out of shot, sit the saved AI insights and the action items raised against
the dashboard.
Walk the screen
-
Read the
Getting Startedbanner for how much of your onboarding is done. The chevron expands the outstanding steps, each with aGolink to the screen that completes it, and aView full getting started guidelink at the foot; the×dismisses the banner, which also disappears on its own once every step is ticked. -
Select
What needs my attention?to open theAttention Feedpanel, which briefs you on the highest-priority items across every module. Next to it,Ask AIopens the assistant with your compliance posture already in context. -
Read the
Compliancecard for the single overall score —0%here. Select the card to open Compliance frameworks, where the controls behind the number live. -
Select the small
?in the corner of a card —Open Risksshows215of498total here — and the AI explains what that metric means and what the current value is telling you. The?does not follow the card's link. -
Scan
Framework Progressfor a percentage bar per framework —BSI C5:2020at 2%,CyberFundamentals Frameworkat 1% and the rest at 0% in the capture, with+25 morebeneath. The panel shows as many rows as its height allows and counts the remainder. -
Use the selector on the
Compliance Trendchart to switch betweenAll frameworks(one combined line) andPer framework(one line each). The figure beside the selector is the current score and its change. The selector appears only when more than one framework has trend data; below that, the chart shows the combined line and nothing to switch.
Reading the numbers
Every card is both a figure and a shortcut: selecting one opens the module it comes from. The border colour reflects the value against its thresholds, but the number and its subtitle carry the meaning, so you never have to read the colour.
| Card | What it counts | Opens |
|---|---|---|
Compliance |
Overall score across your active frameworks, 0–100% | /compliance |
Policies |
Every policy that is not retired — drafts and policies in review included | /policies |
Open Risks |
Open risks, with the total register size beneath | /risks |
Vendors |
Active vendors, with the high-risk count beneath | /vendors |
Pending Reviews |
Policies in review or due for a periodic review | /policies |
Vulnerability Intelligence |
CVEs tracked and actively exploited, with the sync state | /risks |
Treat the compliance score as a guide, not a grade. It is the share of controls
in your enabled frameworks that currently count as compliant, so a workspace
with thirty frameworks enabled and almost no controls assessed reads close to
zero — which is what the capture shows: two frameworks at 1–2%, the rest at 0%,
an overall 0%. A low score early in a programme is normal.
Compliance work is continuous; a high score means few known gaps today, not that
the work is over.
Vulnerability Intelligence comes from a separate sync service. In
the capture it reads Synced, 32,488 CVEs tracked (CVE
— a public catalogue of known software vulnerabilities),
1,676 actively exploited, last run three hours ago. Where that sync
is not switched on the card reads Not configured with the hint
"Enable Hermes V3 sync to track CVEs" — a resting state, not an error.
The AI assist
Both AI actions on this page are read-only: they summarise what is already in your data, never change a record, and keep nothing unless you ask them to.
-
Select
What needs my attention?. A panel opens listing what the briefing covers — open incidents and untreated risks, policies and vendors awaiting approval, frameworks with low control coverage — and states that Aegis ranks the items from your live data while the AI only narrates that ranking. -
Select
Brief me. The briefing streams in, with its confidence and the evidence used shown at the end;Refresh briefingruns it again on current data. -
Select
Save as recordto keep a briefing. It appears in the saved AI insights panel below the grid, from where you can turn it into an action item with an owner and a due date. -
For a single number instead, select the
?on a card.Explain this metricopens with the metric name and current value; selectExplainfor a plain-language account of what it means and what to do next, which you can save the same way.
Each briefing or explanation is a billable AI action against your workspace's monthly allowance and is written to the AI usage log. When the allowance is spent, the panel says the quota has been reached rather than returning a stale answer. A person reads the output and decides what to do with it — Aegis never acts on it by itself.
Refreshing the data
-
Select
Refreshat the right of the toolbar row. The icon spins, the label readsRefreshing..., and the widgets re-read their figures from the server.
Left alone, the page refreshes every five minutes and server-rendered widgets revalidate about once a minute, so a change made in another tab arrives on its own within that window. There is no per-widget refresh setting; for activity as it happens, use the audit log.
Rearranging your dashboard
The grid is twelve columns wide and reflows on smaller screens. Every widget has a minimum and maximum size, and you resize within those bounds.
-
Select
Customize. The grid switches to edit mode and shows the hint "Edit Mode:Drag widgets to reposition, resize by dragging corners, or click the X to remove widgets." Each widget gains size controls and a remove control. -
Drag a widget to move it and drag a corner to resize it. Each widget also
gains three size buttons —
S,MandL, which readCompact,StandardandExpandedwhen you hover — and an×that removes it. Neighbouring widgets move out of the way as you drag. -
Select
Add Widgetto open theWidget Library. It lists only the widgets that are not already on your grid, in their categories, each with a one-line description. Aegis ships 23 in all —KPI(9),Chart(4),Feed(2) andOperations(8) — so with the default layout in place 13 are on offer. Choose one and it lands on the grid. Once every widget is placed the panel reads "All available widgets are already on your dashboard." -
Select
Save Layoutto keep the arrangement,Cancelto drop it, orReset to Defaultto go back to the ten-widget default — the reset asks you to confirm first, because your customisations are lost. AnUnsaved changesmarker appears while edits are pending. A saved layout follows your account, so it is there next time you sign in on any device.
The Getting Started banner is not one of the 23 widgets. It sits
above the grid, driven only by your onboarding progress and its own dismiss
button, so it never leaves a gap in your layout.
When the dashboard looks empty
A new workspace shows small numbers and flat charts; that is the honest picture,
not a fault. Framework bars read 0% until someone assesses the controls behind
them. The
Compliance Trend line is worked out from your live data as the page
loads: six monthly points, each the share of controls that had evidence attached
by the end of that month. Enabling a framework lowers every point at once,
because its controls join the denominator straight away — a dip after switching
a framework on is arithmetic, not a regression. The Risk Heatmap is
a five-by-five grid of likelihood against impact, so a risk without both
recorded lands in no cell and is not plotted at all.
Tips and limits
- Layouts are stored per person and cannot be shared with a team today.
- A zero can be correct. Before treating one as a fault, open the module behind the card and check there.
-
Open Riskscounts open risks; theRisk Heatmapplots a broader set that includes risks in progress. The two figures are meant to differ. - Only ten of the 23 widgets are on the default layout. Remove a card you never read, and add the widget for a module you check daily.
Where this connects
Most cards are a doorway into Compliance frameworks, Policies, Risks or Vendors; the banner leads to Getting Started, and what you save from an AI panel appears in Action Items. The frame around every page is covered in The screen layout and The left menu at a glance, what your role allows in What each role can do, and the wider AI features in AI dashboard and AI agents.