Incidents
Get a security event on record the moment it is detected, work it from investigation to closure, and keep the regulators' notification clocks in view while you do.
An incident is something that has already happened — not a risk that might. This module records the event, moves it through a defined lifecycle while stamping the time at every step, counts down any notification deadline it triggers, and holds the post-incident write-up so the proof is there when an auditor asks. Every change goes to the audit trail.
This chapter is the screen-by-screen reference. To see a response worked as a story — detection, triage, regulator deadlines and the post-incident review — see the full walkthrough in Scenario: respond to a security incident.
Who uses it
- Viewer reads the register and any incident, and can tick rows to export the selection as a CSV file.
- Contributor can also report an incident, move it through its statuses, record a GDPR notification, add timeline entries, record the reporting decision, and close it.
-
Manager can additionally
delete an incident and open the reporting dashboard at
/incidents/reporting; anyone below that role who goes to the address is sent back to the register. -
Admin does all of that, and
alone can open
Auto-Incident Rules— gated on a settings permission a Manager does not hold.
What's on this screen
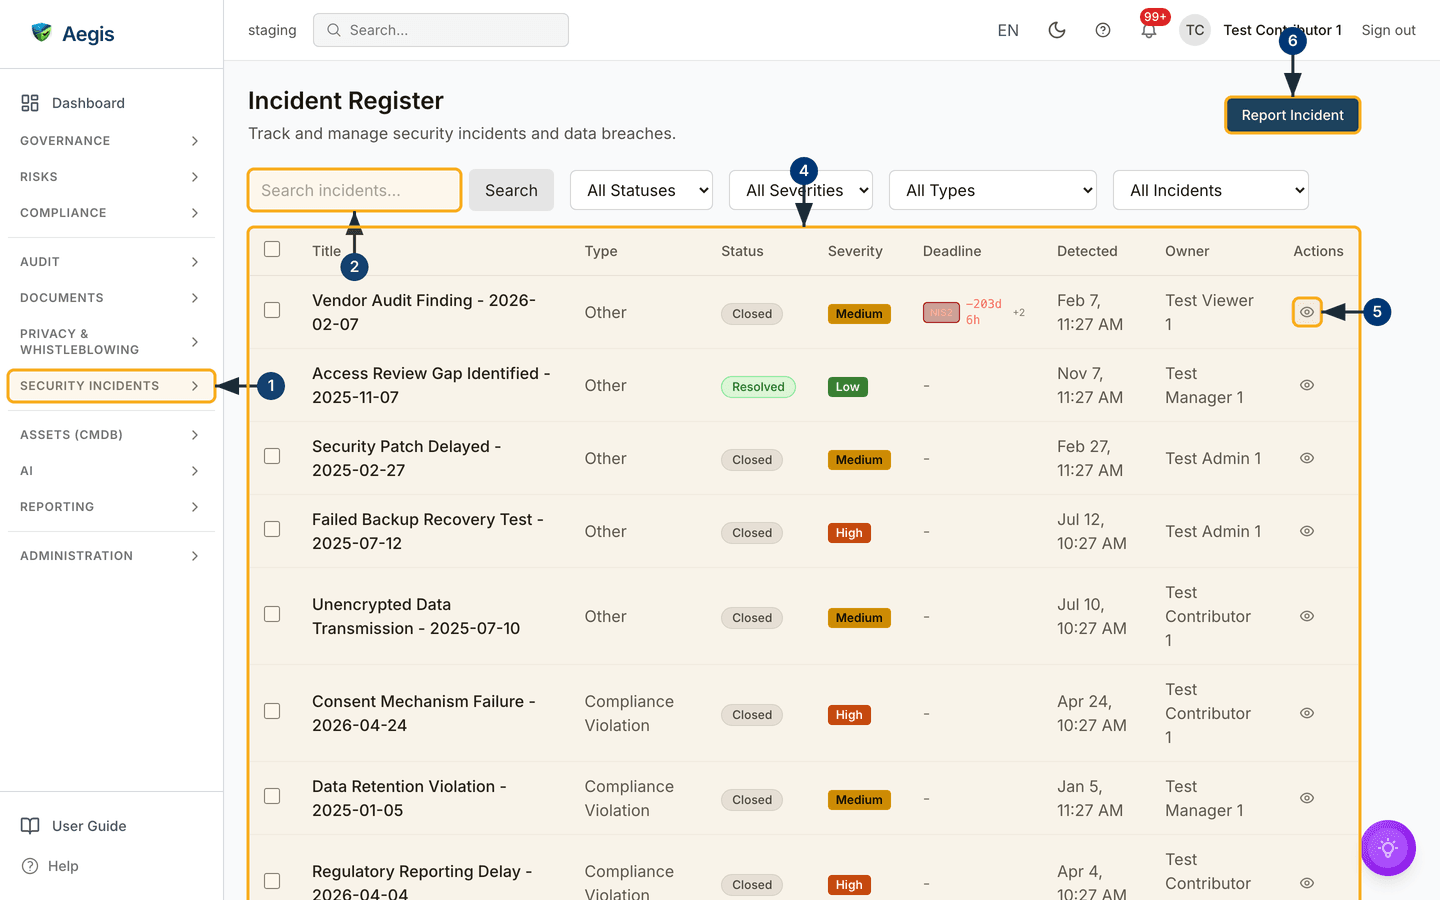
The header reads Incident Register over "Track and manage
security incidents and data breaches", with the dark
Report Incident button on the far right. Beneath it sits the filter
bar: a Search incidents… box with its own
Search button, then All Statuses,
All Severities, All Types and
All Incidents — the last offering
Data Breaches Only or Non-Data Breaches. They combine,
so each one narrows the list further.
The table has a tick-box column, then Title, Type,
Status, Severity, Deadline,
Detected, Owner and Actions. Status and
severity are coloured chips. In the capture below most rows are
Closed with a dash under Deadline — no outstanding
obligation — while the top row carries a red NIS2 chip, an overdue
countdown of −199d 7h, and a +2 marker meaning two
further deadlines sit behind it. A purple GDPR badge marks any
personal-data breach and turns red as GDPR! once 72 hours pass with
no notification recorded. Actions holds an eye icon; a bin icon
joins it for Manager and Admin, so this Contributor view shows the eye alone.
The page loads 20 rows at a time.
-
Open the
Security Incidentsgroup in the left menu and chooseIncidents. The register loads with the most recently detected incidents on top. -
Type a word from an incident's title into
Search incidents…and selectSearch. The table reloads showing only matching titles. - Narrow further with the four dropdowns. Each applies on selection and stacks with the others.
- Select anywhere on a row. The Incident Details dialog opens over the table with that incident's record.
-
Select the eye icon in
Actions— or the title itself — to open the full incident page instead, where the AI panels, the significance wizard and the regulatory filings live. -
Select
Report Incident. The Report New Incident dialog opens over the register.
Statuses and severity
Aegis offers only the valid next steps from the current status.
| Status | Meaning | Can move to |
|---|---|---|
OPEN |
Recorded; investigation not started. |
INVESTIGATING, CONTAINED,
CLOSED
|
INVESTIGATING |
Being analysed; root cause not yet known. |
CONTAINED, RESOLVED, CLOSED
|
CONTAINED |
Stopped from spreading, not yet resolved. |
RESOLVED, INVESTIGATING,
CLOSED
|
RESOLVED |
Root cause addressed; operations resumed. | CLOSED, INVESTIGATING |
CLOSED |
The record is complete. | Nothing — closure is final. |
Severity runs LOW, MEDIUM, HIGH,
CRITICAL, set on reporting and revisable as the investigation
develops.
Reporting an incident
The dialog is short on purpose: during a live response you want the event on record in under a minute and the detail filled in later.
-
Enter an
Incident Title. Required — the dialog will not submit without it. -
Add a
Description: what happened, how it was discovered, first observations. Optional, and it can wait. -
Choose an
Incident Typeand aSeverity. They open onOtherandMedium - Moderate impact; both are required, so change them if those defaults are wrong. -
Fill
When was the incident detected?. The note beneath says this timestamp drives the GDPR 72-hour calculation, and Aegis rejects a time in the future. -
Optionally list
Affected Systemsas a comma-separated line. Each entry becomes a tag on the incident. -
If personal data may have been accessed, disclosed or lost, tick
This incident involves a personal data breach. ANumber of Data Subjects Affectedfield appears; the box is unticked below, so that field is hidden. -
Select
Report Incident. The dialog closes, the incident is created inOPENstatus and the register refreshes with it in place. -
Select
Cancel, or the × in the header, to discard everything you typed.
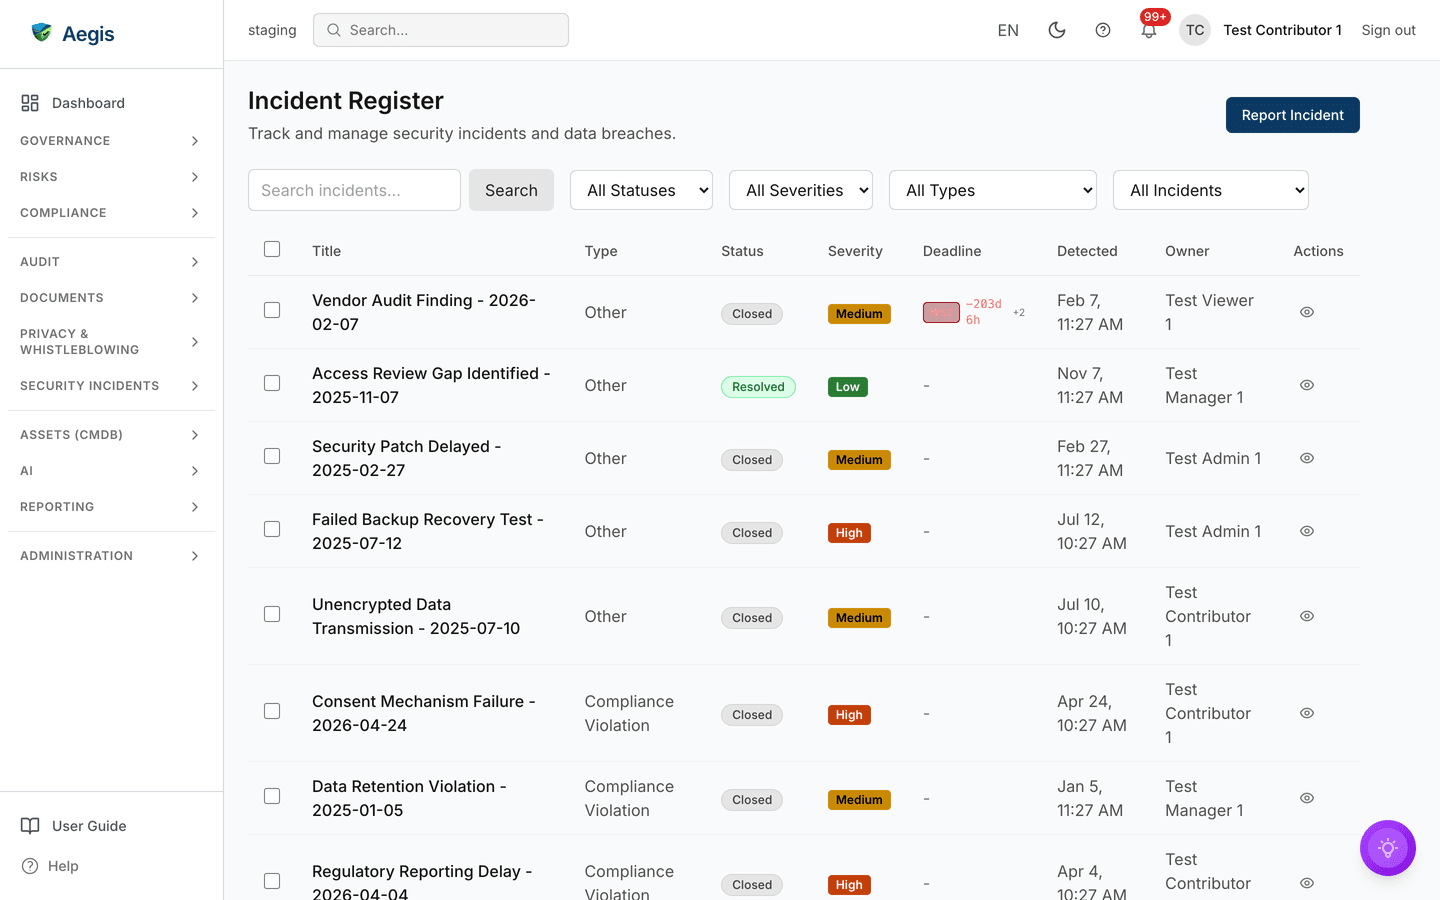
The GDPR 72-hour window and the three NIS2 stages run from the detected time you enter here, not from the moment you log the incident. If you later learn the event started earlier, correct it.
Reading an incident
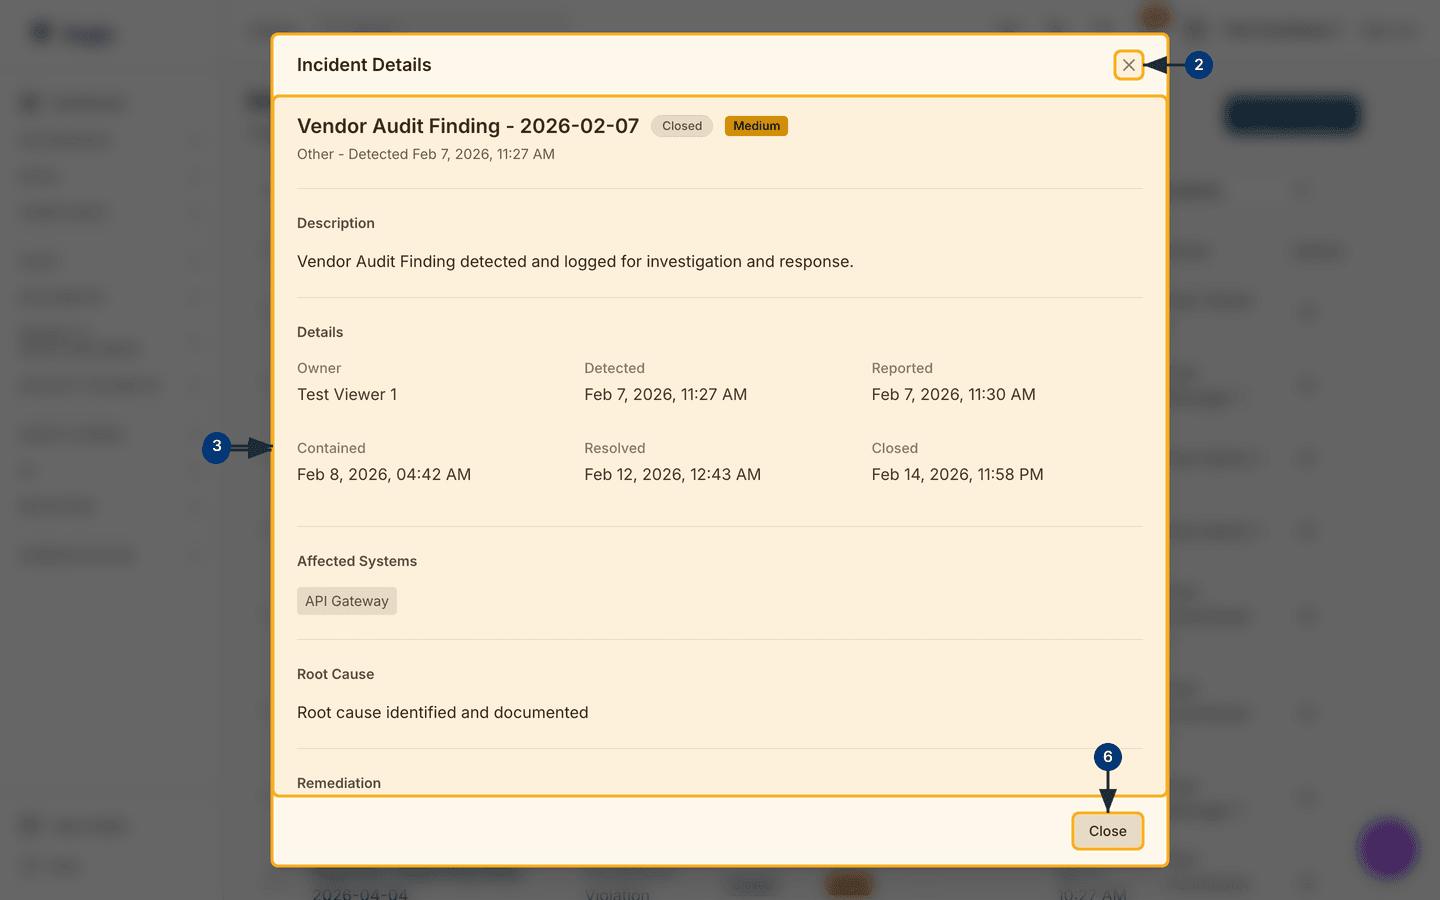
The Details grid and the Timeline always appear; the
Description, Affected Systems,
Root Cause, Remediation and
Lessons Learned panels show only once their field holds something.
The incident below is closed, so no Update Status panel is offered
— there is nothing left to change.
- Select a row in the register. The dialog opens at the top of the record — title, status chip, severity chip, then the type and detected line.
- If you opened the wrong row, select the × in the dialog header. Nothing is changed and you are back on the register.
-
Read the
Description, then theDetailsgrid for the owner and five lifecycle timestamps. A dash means the incident never reached that state. -
Read on through
Affected Systems,Root Cause,RemediationandLessons Learned. A short dialog means a thin record, not a fault. -
Scroll to the
Timelinefor the history in order. Contributors and above get anAdd Entrycontrol here to record a finding while the investigation runs. -
Select
Closeat the foot of the dialog. Anything you changed was saved as you went.
Moving an incident through its statuses
While an incident is still open, an Update Status panel sits
between the header and the description with one button per valid next step.
Viewers do not see it at all.
-
Select the step you want, for example
Mark investigating. The status chip changes, the matching timestamp is stamped and the timeline gains an entry. -
Carry on through
Mark containedandMark resolved. From either you can step back toMark investigatingif new facts reopen the analysis. -
Select
Add Entryin the timeline to record what you found or did. The entry carries your name and the time.
Closing an incident
Mark closed is offered from every status before closure, not only
from RESOLVED, and it opens a confirmation dialog rather than
closing on the spot.
-
Select
Mark closed. The Close Incident dialog names the incident and states that this marks it resolved and will set the closed timestamp. -
Optionally fill
Resolution Summary (Optional). Whatever you write is saved into the incident'sLessons Learnedfield. -
Select
Close Incident. The status becomesCLOSED, the closure time is recorded and the register refreshes.
Aegis offers no transition out of CLOSED, so a closed incident
cannot be reopened. Check that root cause and remediation are recorded
first; afterwards the only way to add anything is a timeline entry.
Regulatory deadlines
Aegis counts every clock from the detected time. Two European regimes drive the
flags you set here; the Deadline column also counts DORA stages,
but only for an incident classified as a major ICT incident.
GDPR (the EU's data-protection law) requires a personal-data
breach to be notified to the supervisory authority within 72 hours. Flag the
incident as a data breach and an alert shows whether that window is open,
closing or overdue. Once you have notified the authority — inside Aegis or
outside it — select Record GDPR Notification to stamp the time.
That clears the red GDPR! badge and puts the notification in the
audit trail.
NIS2 (the EU cybersecurity law) applies only once an incident has been judged significant. Three stages then run from detection:
| Stage | Window from detection |
|---|---|
| Early warning | 24 hours |
| Incident notification | 72 hours |
| Final report | 1 month |
To make that judgement, open the full incident page and select
Assess Significance in the AI Analysis panel — or
Open Full Assessment if a reading is already there. The
NIS2 Significance Assessment wizard opens over the page. Step
1, Automatic Checks, runs four tests against the record — high or
critical severity, the data-breach flag, at least one affected system, a
high-risk incident type — and counts how many are met. Step 2,
AI Assessment, shows the AI reading if one has been run, and offers
Run AI Assessment or Skip to Decision if not. Step 3,
Decision, asks you to choose Mark as Significant,
which activates the deadlines above, or Not Significant, which
records the judgement without them. Neither takes effect until you select
Confirm.
Filing, deciding and telling people
Three further panels sit on the full incident page.
Regulatory Notifications appears once an incident is a data breach
or marked significant, holding the filings it triggers —
GBA — Personal data breach notification (Belgian Data Protection
Authority, GDPR Article 33) and
CCB — NIS2 significant incident report (Centre for Cybersecurity
Belgium). Select Generate draft, review it, then
Mark as filed and enter the reference the authority gave you.
Reporting Decision holds the judgement itself, separate from the
filing: it reads Pending Decision until someone selects
Record Decision and chooses Report or
Do Not Report with a reason. It then shows the decision, who made
it and when — what a regulator asks for when a breach was assessed and not
reported. Update Decision revises it later.
Communications records what you told people; external messages pass
through Create draft, Approve and Send,
so nothing leaves without a second pair of eyes.
The panel says so itself: drafts are for review only, Aegis transmits nothing to an authority, and the field mappings need sign-off from your data protection officer or legal team. File through the authority's own channel, then record the reference here.
The AI assist
The full incident page carries two AI panels. AI Analysis offers
Assess Significance, weighing the incident against the NIS2
criteria and returning a Likely Significant or
Not Significant reading with a confidence figure, per-criterion
reasoning and the frameworks it thinks apply. Once an incident is marked
significant, the same panel adds a button that drafts each notification stage —
Draft Early Warning, Draft Notification,
Draft Intermediate and Draft Final Report.
AI Triage holds one button, Deep AI Triage, which runs
a longer pass — significance under NIS2, GDPR and DORA, whether this looks like
a personal-data breach, the notification stages and their deadlines, related
risks, affected assets and relevant controls, and prioritised response actions.
The panel says it takes 30 to 90 seconds.
The panel states it plainly, and so do we: these are recommendations drawn from your own records, and a person must confirm them. Neither panel changes a status, marks an incident significant, files a notification or tells anyone. Both need the AI feature enabled for your organisation, and both are write actions — a Viewer can read a finished reading but cannot run one.
Tips and limits
-
The row and the title go to different places. The row opens the dialog; the
title, or the eye in
Actions, opens the full page — the only place with the AI panels, the significance wizard, the regulatory filings, the reporting decision and communications. -
A
+2beside a deadline chip means further deadlines sit behind the nearest one. Open the incident to see them all. - The reporting dashboard lists one row per pending stage, so an incident that is both NIS2 significant and a GDPR breach fills several rows. They are separate obligations, not duplicates.
-
If the AI controls are missing, check the AI feature is enabled for your
organisation and that you hold Contributor or above. The
Assess Significanceprompt appears only while the incident is high or critical severity, or flagged as a data breach, and it stops being offered once the incident is already marked significant. - The foot of the register links to a regulatory and an operational runbook. Both open in a new tab and cover the process around the tool, not the tool itself.
Where this connects
Deadlines across every incident are tracked in Incident reporting. Rules that raise incidents from connector events live in Auto-incident rules. For the personal-data side of a breach see GDPR; to fire a notification or task when an incident opens see Workflows. A recurring incident often belongs in the risk register too, and every change shows in the audit log. For the journey end to end, follow the incident scenario.