Webhooks
Register a webhook (an automatic message Aegis posts to a web address you choose) so another system hears about an event — a policy approved, a risk mitigated, an incident resolved — the moment it happens.
A webhook saves someone the job of signing in to check whether anything has
changed. You give Aegis a URL, tick the events you care about, and set a shared
secret; each time a matching event occurs, Aegis posts a small JSON message to
that URL and the receiving system decides what to do with it. Webhooks are
outbound only — they push information out of Aegis and never carry anything back
in. Webhook Settings is the one screen where an administrator
registers endpoints, switches them on and off, tests them, and reads what was
delivered.
Every webhook action is restricted to administrators. The endpoint list is
also gated behind the Webhook Integrations licence feature: if
your plan does not include it, the page still opens, but in place of the
list you get an amber padlock, the heading
Webhook Integrations, a line explaining that the feature is not
on your current plan, and a View Plans button that takes you to
/settings/license.
Who uses it
- Admin Full access — add, edit, enable, disable, test and delete endpoints, and read each one's delivery history.
-
Manager
Contributor
Viewer No access to this
screen. Opening
/settings/webhooksas any of these roles sends you to the/unauthorizedpage, andWebhooksdoes not appear in their menu.
Roles and what each can do lists the other
administrator-only areas. The shorter address /webhooks brings an
administrator here as well; on a plan without the feature it shows the same
locked notice instead.
What's on this screen
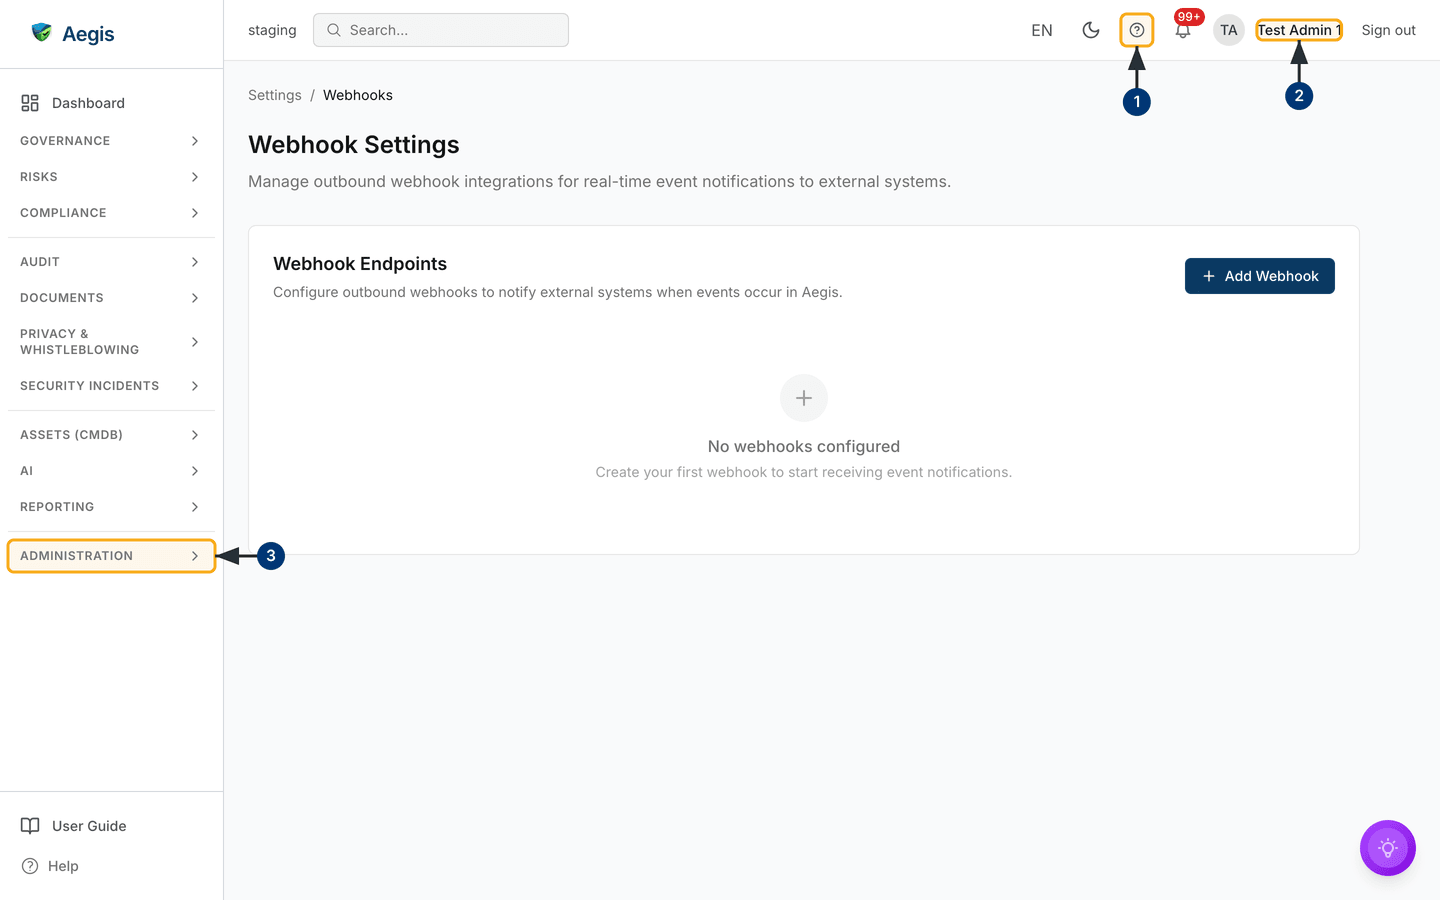
The page is short and has one job. At the top sits a breadcrumb reading
Settings / Webhooks, where Settings links back to the
settings index; under it the heading Webhook Settings and the line
Manage outbound webhook integrations for real-time event notifications to
external systems.
Below that is a single white card titled Webhook Endpoints,
subtitled
Configure outbound webhooks to notify external systems when events occur in
Aegis.
A dark blue Add Webhook button sits in its top-right corner, and
everything else on the screen appears inside that card — no filter bar, no
search, no sorting, because the list is expected to stay short.
In the screenshot below the card is empty, because the workspace it was captured on has no endpoints yet: a grey circle with a plus sign, the line No webhooks configured, and beneath it Create your first webhook to start receiving event notifications. That is the normal starting point for a new organisation.
Once endpoints exist, each becomes a row in the same card. From left to right a
row shows a status pill (Active with a tick, or
Disabled with a cross), the description if you gave one, the
destination URL in a monospaced font, and small grey tags — one per subscribed
event. On the right sit its five controls: an on/off switch (green when the
endpoint is active, grey when it is not), a play icon that sends a test
delivery, a pencil icon that opens the edit form, a bin icon that deletes the
endpoint, and a History button that expands the delivery log
underneath.
Around the card is the usual application frame: the left navigation, whose
ADMINISTRATION group holds Webhooks, and the top bar,
which carries the help ? and your account name — the two controls
the steps below use.
Opening Webhook Settings
-
Select the
?in the top bar whenever you want these instructions to hand. Aegis opens this User Guide in the same tab, already at the chapter for the screen you were on; your browser's back button returns you to the screen. -
Check the name in the top-right corner is the account you mean to use.
Webhook Settings opens only for an administrator; any other role lands on
the
/unauthorizedpage instead. -
In the left navigation, select
ADMINISTRATIONto expand that group, then chooseWebhooks. The page loads at/settings/webhookswith theSettings / Webhooksbreadcrumb and theWebhook Endpointscard — a grey placeholder stands in while the list is fetched. The Settings index links here too.
Add an endpoint
Have the receiving URL ready, and decide on a signing secret — a long random string both sides hold. Aegis signs every message with it, so the receiver can prove the message came from Aegis and was not altered on the way.
-
Select
Add Webhookin the top-right of the card. A dialog opens titledAdd Webhook, with four fields and aCancel/Create Webhookpair at the bottom. -
In
Endpoint URL(required), type the full address Aegis should post to — the field showshttps://example.com/webhooks/aegisas its example. Anything that is not a validhttporhttpsURL drawsInvalid URL formatorURL must use HTTP or HTTPS protocolin red under the field, which clears as you correct it. On a production deployment the server acceptshttpsonly, replyingWebhook URL must use HTTPS. -
In
Description(optional), add a short label such as CI/CD pipeline notifications — it is what identifies the row in the list later. -
In
Signing Secret(required when adding), type your secret. The field is masked and the hint below reads Used to generate HMAC-SHA256 signatures for payload verification. Store the same value on the receiving side; Aegis never shows it back to you. -
Under
Event Types(at least one required), tick the events this endpoint should receive. Ticking a group heading selects the whole group, and that heading shows a partial state when only some of its events are ticked. Submitting with nothing ticked showsSelect at least one event type. -
Select
Create Webhook. The button readsSaving…, then the dialog closes, Webhook created successfully appears, and the new endpoint replaces the empty state as anActiverow.Cancelkeeps nothing.
The events you can subscribe to
The list is fixed — these are the events Aegis can send today, and the dialog
offers no others. Each is named area.action.
| Group | Events |
|---|---|
Policy |
policy.created, policy.updated,
policy.approved
|
Risk |
risk.created, risk.updated,
risk.mitigated
|
Vendor |
vendor.created, vendor.assessed |
Evidence |
evidence.uploaded, evidence.expired |
Incident |
incident.created, incident.resolved |
Compliance |
compliance.score_changed |
What arrives at your endpoint
Aegis sends an HTTP POST whose JSON body holds the event name, a
timestamp and a data object identifying the record that changed. With it travel
X-Aegis-Event, X-Aegis-Delivery (unchanged across
retries of the same event) and X-Aegis-Signature-256, whose value
is sha256= followed by an HMAC-SHA256 digest of the exact body.
Whoever builds the receiver should recompute that digest with the shared secret,
compare the two, then reply with a 2xx status code. Aegis waits about ten
seconds and treats anything else — a timeout, a redirect, any non-2xx status —
as a failed delivery.
Send a test delivery
Test an endpoint before you rely on it, so a wrong URL or a rejected signature turns up at a quiet moment rather than during a real incident. A test runs through the same pipeline as a real event — the address check, the signing and the retries.
- Find the endpoint's row. It has to be switched on — the play icon is dimmed and does nothing on a disabled endpoint.
-
Select the play icon (tooltip:
Send test delivery). It turns into a spinner, then Test delivery enqueued. Check delivery history for results. appears. The message carries the event typewebhook.test. -
Select
Historyon the same row to read the result. The delivery runs in the background, so give it a moment and use the panel's refresh icon if the attempt has not appeared.
Turn an endpoint off, on, or change it
-
To stop deliveries without losing the configuration, select the green switch
on the row. It turns grey, the pill changes to
Disabledand Webhook disabled appears. Selecting it again re-enables the endpoint. A disabled endpoint receives nothing and cannot be tested. -
To change an endpoint, select the pencil icon. The same dialog opens, now
titled
Edit Webhookand pre-filled with the current URL, description and ticked events. -
Adjust whatever you need.
Signing Secretis deliberately blank and shows Leave blank to keep current secret — type a value only to replace the secret, and update the receiving system at the same moment, because messages signed with the new secret start straight away. -
Select
Update Webhook. The dialog closes, Webhook updated successfully appears and the row refreshes with the new URL, description and event tags.
Read the delivery history
Every attempt against an endpoint is recorded, failures included, so you can see what was sent and how the receiver replied.
-
Select
Historyon the row (tooltip:View delivery history). A panel opens beneath the row and the button now readsHide. Once there are attempts to show, the panel is headedRecent Deliveriesand lists the ten most recent. -
Read each line left to right: a green tick or a red cross, the event type,
the HTTP status code the receiver returned (green below 300, red otherwise,
N/Awhen there was no reply), any error text, and the time of the attempt on the right. -
Use the refresh icon at the top of the panel to reload it — worth doing
straight after a test. If nothing has been delivered the panel reads
No delivery history yet. with its own refresh icon beside it.
Select
Hideto close the panel.
A failed delivery is retried automatically — up to three further attempts, the first about a minute later and with a growing gap after that — and each gets its own line. Several red lines for one event usually mean the receiver is down or rejecting the signature, not that the event was lost.
Delete an endpoint
-
Select the bin icon on the row. A confirmation dialog opens, titled
Delete Webhook, naming the URL you are about to remove. - Read the message: it states that the action cannot be undone and that the endpoint's delivery history goes with it.
-
Select
Delete webhookto go ahead, orCancelto keep the endpoint. The row disappears and Webhook deleted successfully appears.
There is no undo, and the record of what was sent to that endpoint goes too. A message already queued when you delete may still make one last attempt, so a receiver should handle a repeated delivery without harm. To stop messages for a while, disable the endpoint with the switch instead — that keeps both the configuration and its history.
Tips and limits
- One endpoint per receiving system, with its own secret. That lets you disable, re-key or delete one without disturbing the others.
- Treat the secret as a password. It is masked as you type and never displayed again. If it leaks, edit the endpoint, set a new secret, and update the receiver.
-
Use a publicly reachable URL, and the final one. Aegis
blocks destinations that resolve to your own internal network and does not
follow redirects — a 3xx reply is recorded as a failed delivery rather than
chased. Placeholder text such as
stringornullis rejected in the signing secret and the description, and a URL pointing at a known security-scanner host is refused outright. - Subscribe narrowly. The event list is fixed, and a receiver that gets everything has more to filter and more to go wrong. Tick only what the other system acts on; if you need an event that is not in the table above, raise it with your Aegis contact.
- Changes here are recorded. Adding, editing, testing and deleting endpoints is written to the Audit Log, as is each successful delivery. The signing secret is never included in that record.
Where this connects
- Settings — the area this page sits under, including your plan and licence details.
- Connectors — pulling data into Aegis from other services; the inbound counterpart to outbound webhooks.
- API Keys — letting your own scripts call Aegis directly instead of waiting to be told.
- Policies, Risks, Vendors, Evidence and Incidents — the modules whose events you can subscribe to.
- Getting help — if deliveries keep failing and the history does not explain why.