Control Mapping
See where two compliance frameworks ask for the same thing, so one piece of evidence can answer several requirements instead of being gathered twice.
Most organisations satisfy more than one
framework (a published set of security or
compliance requirements, such as NIS2 or ISO 27001), and many frameworks ask for
the same underlying control (a specific
safeguard, such as multi-factor sign-in) in different words. Control Mapping
lays those overlaps out side by side. Its first workbench,
Cross-Framework Alignment, shows which controls correspond across
frameworks, how strong each overlap is, and where the same
evidence (the proof a control works) could be
reused.
Nothing on this screen changes your compliance data. It reads the mappings that already exist and presents them four ways: headline counts, a relationship diagram, an overlap matrix, and a searchable table.
Who uses it
The page requires only a signed-in account, and everyone sees the same screen — there is nothing here that a higher role unlocks, because there is nothing here to change.
- Admin and Manager plan which frameworks to take on next and where the evidence workload can be shared.
- Contributor checks, before collecting evidence, whether a control already has a mapped counterpart elsewhere.
- Viewer can read all of it — counts, diagrams, mapping table and comparisons.
The sibling Deduplication tab does contain actions: generating,
accepting or rejecting an AI suggestion there needs the compliance-update
permission, which only Manager and
Admin hold. A Contributor or Viewer
can open that tab and read it, but cannot act on a suggestion.
What's on this screen
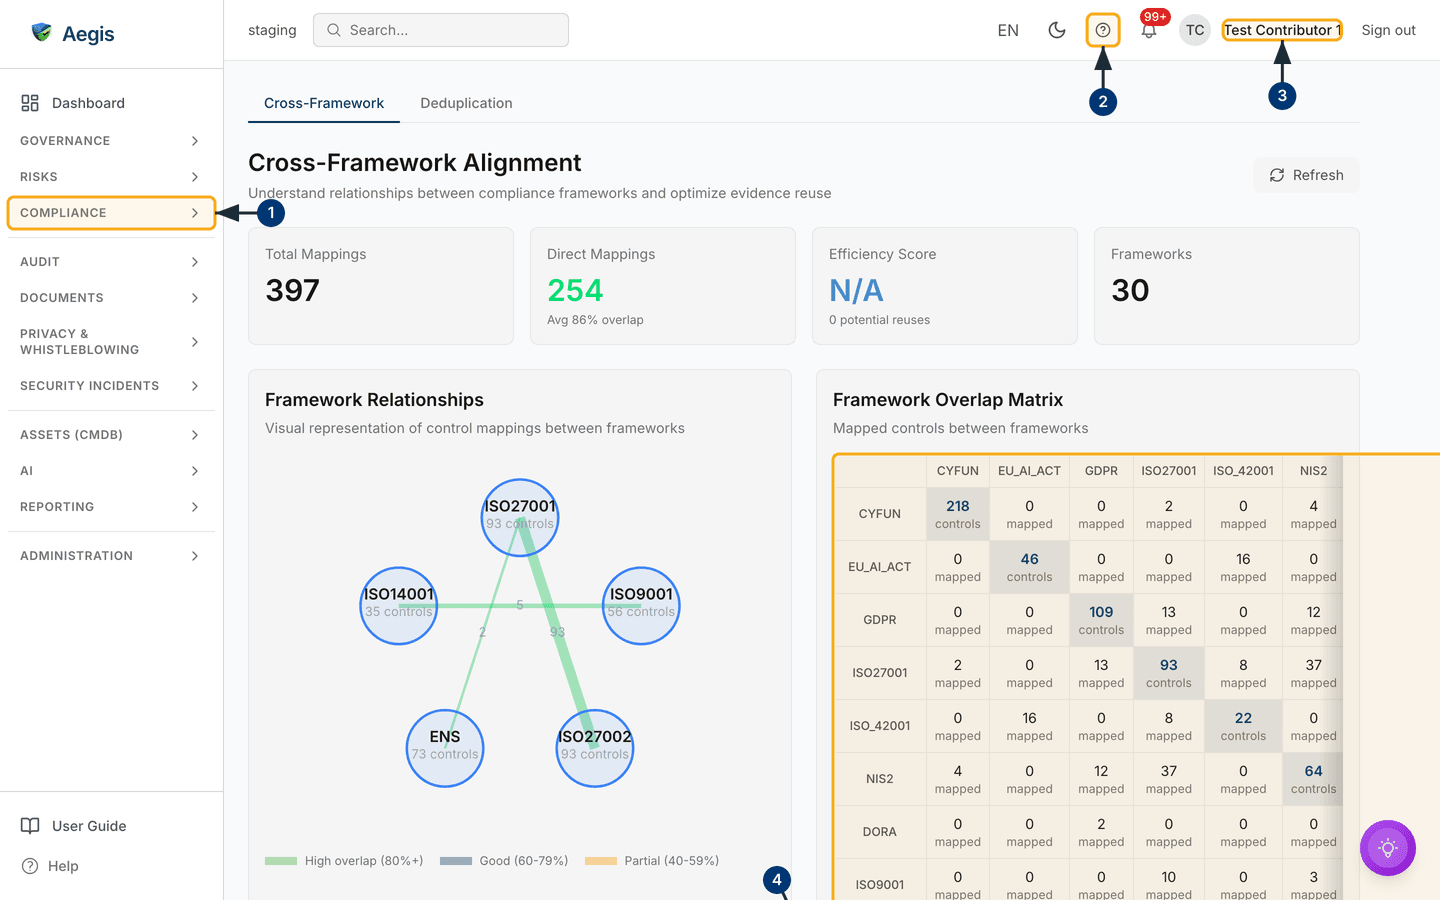
Two tabs sit at the very top: Cross-Framework (the view you land
on) and Deduplication. Below them is the page heading
Cross-Framework Alignment, a one-line description, and a single
Refresh button on the right that re-fetches the figures without
reloading the page.
Under the heading is a row of four summary cards:
Total Mappings (397 in the captured screen),
Direct Mappings in green with an average-overlap line beneath it
(254, Avg 86% overlap), Efficiency Score with a
potential-reuses line beneath it (N/A,
0 potential reuses), and Frameworks (30).
Next come two panels side by side. On the left,
Framework Relationships draws a labelled bubble with its control
count for each framework in the batch of mappings the page has loaded — ISO27001
(93 controls), ISO14001 (35), ISO9001 (56), ENS (73) and ISO27002 (93) in the
capture — joined by coloured lines whose thickness reflects the number of
mappings and whose colour reflects average overlap. A legend beneath reads
High overlap (80%+), Good (60-79%) and
Partial (40-59%). On the right,
Framework Overlap Matrix lists every framework with at least one
recorded mapping down the rows and across the columns; each cell gives the
mapped-control count for that pair, the shaded diagonal the framework's own
control count. It is wider than its panel, so it scrolls sideways.
Below the fold sit two more regions: the Evidence Efficiency panel
and the Control Mappings table with its search box and two filter
lists.
Opening Control Mapping and getting oriented
-
In the left menu, open the
COMPLIANCEgroup and selectControl Mapping. TheCross-Framework Alignmentview opens on theCross-Frameworktab. -
The
?in the top bar opens the in-app User Guide in the content area, at the chapter for the screen you came from. The sidebar and top bar stay where they are. -
Your name and initials sit at the top right, with
Sign outbeside them — the role behind that name does not change what this page shows. -
The
Framework Overlap Matrixon the right is the fastest read of the page: any cell above zero is a framework pair that already shares mapped controls. Drag it sideways for the columns beyond the panel edge.
Reading the four headline cards
The cards give the shape of the picture before you read any single mapping.
-
Read
Total Mappingsfor the recorded relationships between controls across every framework in scope — 397 in the capture. -
Read
Direct Mappingsfor the one-to-one equivalents, and the line beneath for their average overlap. These are where evidence reuse is most likely to hold up. -
Read
Efficiency Scorefor how much evidence is already doing double duty. The capture showsN/Aand0 potential reuses, because no evidence is yet attached to mapped controls there. -
Read
Frameworksfor how many frameworks are switched on in your tenant — 30 in the capture, whether or not any of them has a mapping yet. SelectRefreshafter work elsewhere to pull current figures.
The four cards and the matrix count every mapping (397 in the capture). The
Framework Relationships diagram and the
Control Mappings table are built from the batch the page loads
— the 100 mappings with the highest overlap. That is why the diagram draws
five frameworks while the matrix shows mapped counts for DORA, CYFUN, NIS2
and GDPR as well: their mappings fall outside that batch. Read the diagram
as the strongest overlaps, not as the whole picture, and use the matrix when
you need a specific pair.
Reading the Framework Relationships diagram
- Find each framework bubble and note its control count.
- Follow the lines between bubbles. A thicker line means more mappings connect that pair, and the small number on it is the mapping count within the loaded batch — ISO27001 and ISO27002 are joined by a thick line labelled 93, ISO27001 and ENS by a thin one labelled 2, ISO14001 and ISO9001 share 5. Thickness stops growing past eight mappings, so two very busy pairs look alike.
- Check the colour against the legend: green is a high overlap (80% or more), blue good (60–79%), amber partial (40–59%). A pair averaging under 40% is drawn red, which the legend does not list. A thick amber line therefore means many mappings that each only partly match.
Reading the Framework Overlap Matrix
- Find your framework in the row headings down the left — CYFUN, EU_AI_ACT, GDPR, ISO27001, ISO_42001, NIS2, DORA and ISO9001 all appear in the capture.
-
Read across. The shaded cell where the row meets its own column gives that
framework's control count (ISO27001,
93 controls); every other cell gives the mapped count for the pair (37 mappedwhere ISO27001 meets NIS2). -
Scroll sideways for the remaining columns. A row of near-zeros — DORA shows
2 mappedagainst GDPR and zero elsewhere — means that framework has barely been mapped yet, not that it has nothing in common with the others.
Judging evidence reuse
Below the two panels, Evidence Efficiency restates the score as a
coloured badge — green from 75%, amber from 50%, red below, grey when there is
no data. Three tiles follow: Already Shared (evidence items
attached to both controls of a mapping), Reuse Opportunities (items
attached to one side that could serve the other) and
Potential Savings (the redundant uploads that reuse would avoid).
Beneath them, High-Overlap Mappings counts mappings at 70% or more.
The Efficiency Recommendations box gives standing advice rather
than named mappings: review the reusable evidence items, and concentrate on
mappings at 70% or more.
Every figure in this panel is drawn only from mappings at 70% overlap or more, so it describes your strongest candidates rather than all your evidence. Read it as a shortlist, not a scorecard: it shows where reuse looks plausible, and your team still confirms the evidence answers both requirements.
Finding and comparing a specific mapping
The Control Mappings table at the foot of the page lists the
mappings the page has loaded — up to 100, highest overlap first — under the
columns Primary Control, Related Control,
Type, Overlap (a bar and a percentage),
Description and Actions.
-
Type into
Search mappings...to match a control reference, title or mapping description. The table filters as you type. -
Narrow by relationship using the type list —
All Types,Direct,Partial,ComplementaryorParallel Process. -
Narrow by framework using the framework list, which offers every framework
switched on in your tenant. If nothing matches, the table shows
No mappings found— which can also mean the mapping exists but sits outside the loaded 100. -
Select a row, or
Comparein itsActionscolumn, to open theControl Comparisondialogue: mapping type and overlap at the top, theMapping Relationshipdescription, the two controls side by side with theirRequirementsandStatus, thenShared RequirementsandKey Divergenceswith their counts, and anOverlap Percentagebar at the foot. -
Read the divergences before reusing anything — they are the parts still
needing separate work.
Closereturns you to the table with your filters intact.
| Mapping type | What it means for your evidence |
|---|---|
Direct |
The two controls ask for the same thing. Evidence for one usually answers the other, subject to the listed divergences. |
Partial |
They overlap, but one asks for more. Reuse part of the evidence and add to it. |
Complementary |
Same risk, different angles. Both are usually needed; evidence is rarely interchangeable. |
Parallel Process |
Separate processes running alongside each other. Related reading rather than a reuse opportunity. |
The Deduplication tab
Select Deduplication at the top of the page to switch to the second
Control Mapping workbench, Cross-Framework Deduplication. Where the
Cross-Framework view explains how frameworks relate, Deduplication works on the
controls themselves: it gathers near-identical controls into one unified view,
estimates the implementation effort that saves, and lists suggested groupings
for a person to accept or reject. Filter pills limit it to chosen frameworks;
status tabs separate undecided suggestions from handled ones.
The AI assist
The Cross-Framework view has no AI in it — every number comes from
mapping records already in your tenant. On the Deduplication tab,
AI proposes which controls belong in the same group, and those proposals stay
suggestions: a Manager or
Admin has to accept or reject each
one, and nothing is grouped until they do. AI assists; the organisation decides.
Tips and limits
- You cannot author or edit a mapping here. Mappings come from the framework definitions Aegis ships with and from groupings accepted on the Deduplication tab.
- Overlap percentages and the efficiency score guide prioritisation, not compliance: a high overlap means the same evidence may apply, not that either control is satisfied.
-
An
N/Aefficiency score is a data state, not a fault: it appears when no evidence is yet attached to mapped controls, and becomes a percentage once evidence is linked. - Use the diagram to see which pairs are strongly aligned, the matrix to look up one specific pair — only the matrix and the four cards see all your mappings.
- There is no paging control below the table, so the 100 loaded mappings are as far as this screen goes. The search box and both filter lists work on that batch, so a low-overlap mapping can be absent from the table even though the matrix counts it.
- Frameworks are licensed individually, so what you see in scope depends on your organisation's entitlements (the frameworks your licence covers). SOC 2 is on the roadmap and is not part of this mapping data.
-
If figures look stale, select
Refreshrather than reloading the page — it re-fetches counts, mappings and efficiency metrics together.
Where this connects
- Compliance frameworks — where each framework's controls and progress live.
- Control monitoring — how individual controls are implemented and scored.
- Evidence — the proof you attach to controls, and what this screen helps you reuse.
-
The left menu — the
COMPLIANCEgroup holding this screen. - Glossary — control, evidence, framework and the other terms used here.